বলিঙ্গার ব্যান্ডস চ্যানেলের উপর ভিত্তি করে ব্রেকআউট রিগ্রেশন কৌশল
ওভারভিউ
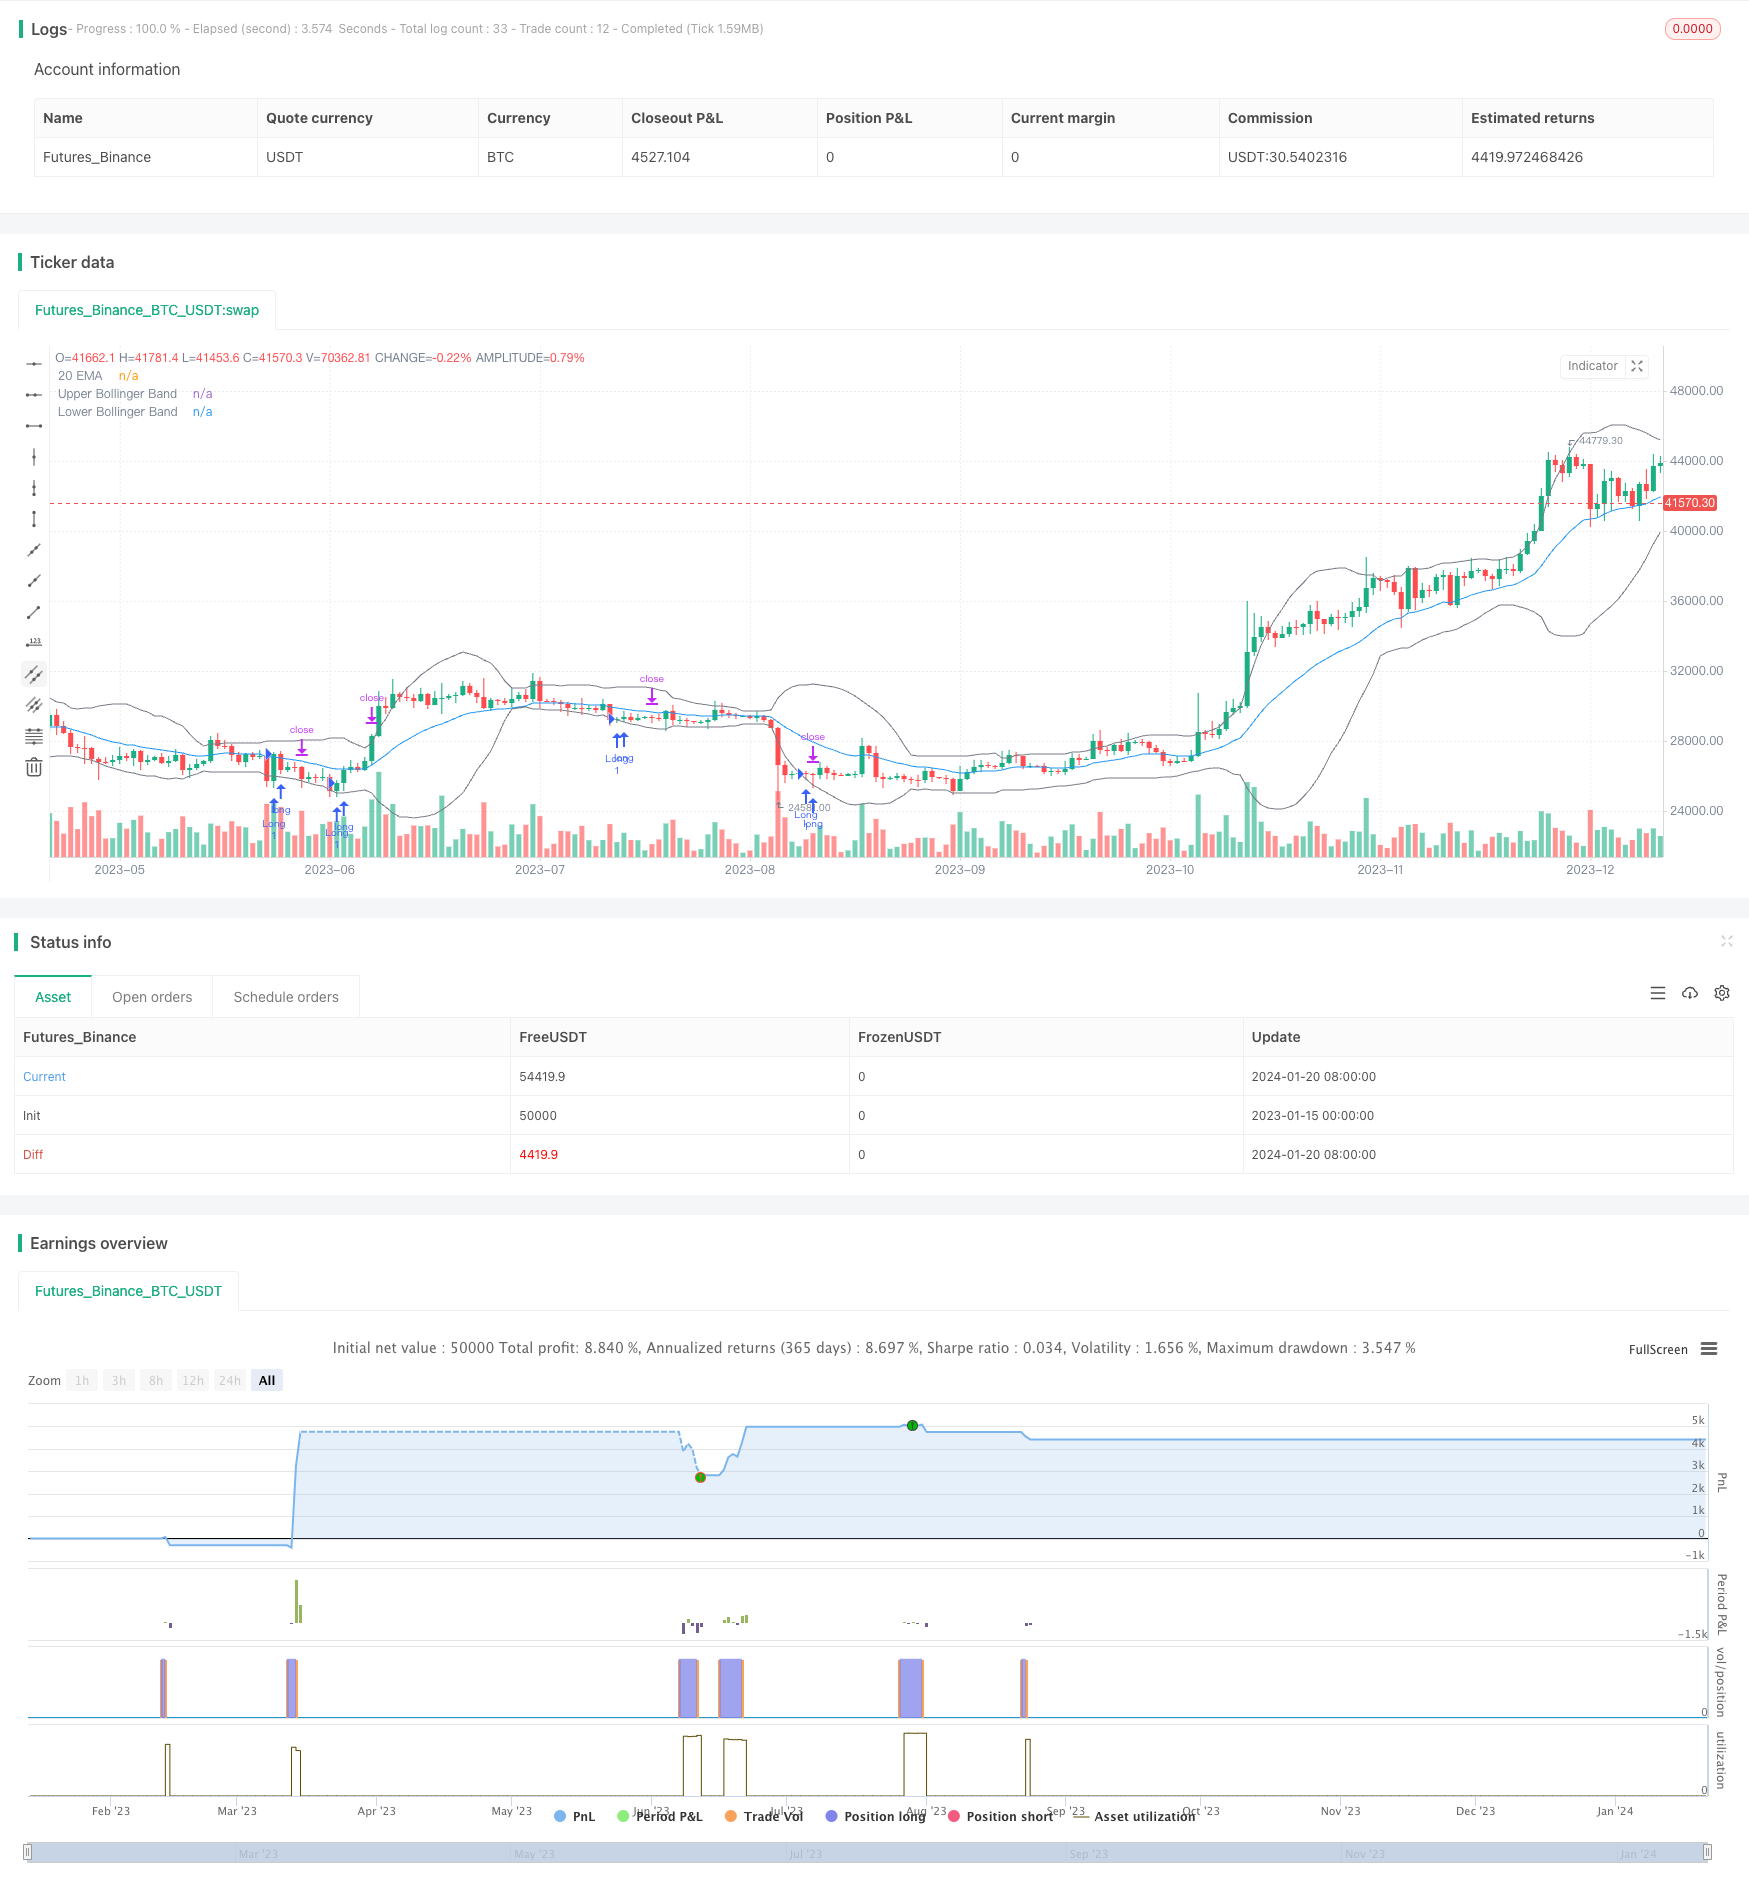
এই কৌশলটি বুলিন বন্ডের পুনরাবৃত্তির উপর ভিত্তি করে তৈরি করা হয়েছে। যখন দামগুলি বুলিন বন্ডের নীচে নেমে আসে তখন দীর্ঘ পজিশনে প্রবেশ করা হয়। স্টপ লসটি প্রবেশের ব্রেক পয়েন্টের সর্বনিম্ন মূল্য হিসাবে সেট করা হয়। স্টপ লসটি বুলিন বন্ডের ট্র্যাকের জন্য লক্ষ্যযুক্ত।
কৌশল নীতি
এই কৌশলটি ২০টি চক্রের একটি বুলিন-ব্যান্ড-চ্যানেল ব্যবহার করে। বুলিন-ব্যান্ড-চ্যানেলটি মিড-রেল, আপ-রেল এবং ডাউন-রেলের সমন্বয়ে গঠিত। মিড-রেলটি ২০টি চক্রের একটি সরল চলমান গড়, আপ-রেলটি মিড-রেল থেকে স্ট্যান্ডার্ড ডিফেন্ডার দ্বিগুণ যোগ করে এবং ডাউন-রেলটি মিড-রেল থেকে স্ট্যান্ডার্ড ডিফেন্ডার দ্বিগুণ বিয়োগ করে।
যখন দামটি ট্র্যাকের নীচে পড়ে যায়, তখন দামটি ওভারসোল অবস্থায় প্রবেশ করে, তখন লং পজিশনে প্রবেশ করা হয়। প্রবেশের পরে, স্টপ লস দামটি প্রবেশের সময় কে লাইনের সর্বনিম্ন মূল্য হিসাবে সেট করা হয়, স্টপ-আপ লক্ষ্যটি বুলিন বন্ডকে ট্র্যাক করে। এইভাবে, কৌশলটি হ’ল মূল্যকে ওভারসোল থেকে সমান্তরাল লাইনে ফিরিয়ে আনার প্রক্রিয়াটি অনুসরণ করা এবং লাভ অর্জন করা।
কৌশলগত শক্তি বিশ্লেষণ
এই কৌশলটির সুবিধাগুলো হলঃ
- বুলিন-বেল্ট-চ্যানেলের সাহায্যে ওভার-বয় ওভার-সেলের অবস্থা নির্ণয় করা, যা সময়োপযোগী।
- ডকনামকে অনুসরণ করা থেকে বিরত থাকার জন্য ট্রেডিং কৌশলতে ফিরে আসুন
- স্টপ লস পয়েন্টগুলি যুক্তিসঙ্গত এবং ঝুঁকি নিয়ন্ত্রণে সহায়ক
ঝুঁকি বিশ্লেষণ
এই কৌশলটির কিছু ঝুঁকিও রয়েছেঃ
- বুলিন বন্ডে দামের প্রবণতা সম্পর্কে সঠিক ধারণা পাওয়া যায় না, এবং দামের পতন ঘটার পরেও এটি পুনরুদ্ধার হয় না।
- Floating P/L-এর পতন অব্যাহত থাকলে, এটি প্রথমে স্টপ লস ট্রিগার করতে পারে
- স্টপ পয়েন্টটি রেলের কাছাকাছি, স্টপ খরচ বেশি হওয়ার ঝুঁকি
কৌশল অপ্টিমাইজেশনের দিকনির্দেশনা
এই কৌশলটি নিম্নলিখিত দিকগুলি থেকে উন্নত করা যেতে পারেঃ
- ব্রিন-ব্যান্ড প্যারামিটারগুলিকে অপ্টিমাইজ করুন এবং সর্বোত্তম প্যারামিটার সমন্বয় খুঁজুন
- প্রবেশের সঠিকতা বাড়ানোর জন্য অন্যান্য সূচক ফিল্টার সংকেত যুক্ত করা হয়েছে
- স্টপ লস কৌশলকে অপ্টিমাইজ করুন এবং লাভ-ক্ষতির অনুপাত বাড়ান
সারসংক্ষেপ
এই কৌশলটি সামগ্রিকভাবে সুস্পষ্ট এবং কিছুটা কার্যকরী। তবে এটি ব্রিনের বন্ডটি ব্যবহার করে ওভারবয় ওভারসেলের সময়কার্যতা খুব বেশি নয়, দামের প্রবণতা পুরোপুরি বিচার করতে পারে না। এছাড়াও, স্টপ-অফ স্টপ লস প্রক্রিয়াটি অপ্টিমাইজ করা দরকার। পরবর্তীকালে আরও সঠিক সূচক নির্বাচন, অনুকূলিতকরণ প্যারামিটার এবং স্টপ-অফ স্টপ লস প্রক্রিয়া উন্নত করার ক্ষেত্রে কৌশলটির লাভজনকতা বাড়ানো যেতে পারে।
/*backtest
start: 2023-01-15 00:00:00
end: 2024-01-21 00:00:00
period: 1d
basePeriod: 1h
exchanges: [{"eid":"Futures_Binance","currency":"BTC_USDT"}]
*/

// This source code is subject to the terms of the Mozilla Public License 2.0 at https://mozilla.org/MPL/2.0/
// © Ronsword
//@version=5

strategy("bb 2ND target", overlay=true)

// STEP 1. Create inputs that configure the backtest's date range
useDateFilter = input.bool(true, title="Filter Date Range of Backtest",
     group="Backtest Time Period")
backtestStartDate = input(timestamp("1 Jan 1997"),
     title="Start Date", group="Backtest Time Period",
     tooltip="This start date is in the time zone of the exchange " +
     "where the chart's instrument trades. It doesn't use the time " +
     "zone of the chart or of your computer.")
backtestEndDate = input(timestamp("1 Sept 2023"),
     title="End Date", group="Backtest Time Period",
     tooltip="This end date is in the time zone of the exchange " +
     "where the chart's instrument trades. It doesn't use the time " +
     "zone of the chart or of your computer.")

// STEP 2. See if the current bar falls inside the date range
inTradeWindow = true

// Bollinger Bands inputs
length = input.int(20, title="Bollinger Bands Length")
mult = input.float(2.0, title="Multiplier")
src = input(close, title="Source")
basis = ta.sma(src, length)
dev = mult * ta.stdev(src, length)
upper = basis + dev
lower = basis - dev

// EMA Settings
ema20 = ta.ema(close, 20)
plot(ema20, color=color.blue, title="20 EMA")

// Entry condition
longEntryCondition = ta.crossover(close, lower)

// Define stop loss level as the low of the entry bar
var float stopLossPrice = na
if longEntryCondition
    stopLossPrice := low

// Top Bollinger Band itself is set as the target
topBandTarget = upper

// Enter long position when conditions are met
if inTradeWindow and longEntryCondition
    strategy.entry("Long", strategy.long, qty=1)

// Set profit targets
strategy.exit("ProfitTarget2", from_entry="Long", limit=topBandTarget)

// Set stop loss
strategy.exit("StopLoss", stop=stopLossPrice)

// Plot Bollinger Bands with the same gray color
plot(upper, color=color.gray, title="Upper Bollinger Band")
plot(lower, color=color.gray, title="Lower Bollinger Band")