নির্দেশক কৌশল যা সময় এবং স্থানের মধ্য দিয়ে ভ্রমণ করে
ওভারভিউ
এটি একটি সহজ কোয়ান্টামাইজেশন কৌশল যা মর্ফি সূচককে ব্যবহার করে বাজারে বড় বড় শ্যাওলাকে চিহ্নিত করে। এটি 5 মিনিটের সময় ফ্রেমে কাজ করে, মূলত ক্রিপ্টোকারেন্সি ট্রেডিংয়ের জন্য।
কৌশল নীতি
এই কৌশলটি 3 এর দৈর্ঘ্যের একটি মোফি সূচক ব্যবহার করে, 100 এ ওভার-বই লাইন সেট করে এবং 0 এ ওভার-সেল লাইন সেট করে। কৌশলটি মোফি সূচকটি ওভার-বই স্তরের জন্য অপেক্ষা করে, যা বাজারে একটি বড় শিংয়ের পিলের উপস্থিতির ইঙ্গিত দেয়। যদি দামটি সেই দিনের আগে দুটি মোফি সূচক ওভার-বই পয়েন্ট ধরে রাখতে পারে তবে এটি একটি বহু-প্রবেশের সংকেত।
যখন মোফি সূচক = 100 এবং নিম্নে K লাইন হল বড় সূচক, তখন বেশি প্রবেশ করুন। স্টপ লস লাইনটি সেই ট্রেডিং দিনের সর্বনিম্ন পয়েন্ট হিসাবে সেট করা হয়েছে, প্রবেশের 60 মিনিটের মধ্যে বন্ধ।
ক্রেডিট কমানোর ক্ষেত্রে, মিরর লজিক ব্যবহার করা যেতে পারে। অর্থাৎ, যখন মোফি সূচকটি ওভারসেল হয়, যখন নীচের K লাইনটি বড় শূন্য হয়, তখন ক্রেডিট কমানো শুরু হয়।
কৌশলগত সুবিধা
মর্ফি সূচক ব্যবহার করে, বাজারে সম্ভাব্য শেয়ার জমা করার জন্য বড় ক্যাচারের কার্যকলাপকে কার্যকরভাবে চিহ্নিত করা যায়। এই ধরনের শেয়ারগুলি বাড়তে থাকবে।
অনেক ভুয়া ব্রেকথ্রু ফিল্টার করতে K-লাইন এন্ট্রিগুলির শক্তিশালী ব্রেকথ্রু সনাক্তকরণ ব্যবহার করুন।
এসএমএ ফিল্টারের সাথে, ট্রেডিংয়ের ঝুঁকি হ্রাস করার জন্য ট্রেডিংয়ের ঝুঁকি হ্রাস করার জন্য নিম্ন প্রবণতাযুক্ত শেয়ার কেনা এড়ানো।
ইন-ডে সুপার শর্ট লাইন অপারেশন পদ্ধতি ব্যবহার করে, 60 মিনিটের স্টপ-অফ দ্রুত মুনাফা লক করতে পারে এবং প্রত্যাহারের সম্ভাবনা হ্রাস করতে পারে।
কৌশলগত ঝুঁকি
মফি সূচকগুলি ভুল সংকেত তৈরি করতে পারে, যার ফলে অপ্রয়োজনীয় ক্ষতি হয়। আপনি উপযুক্তভাবে প্যারামিটারগুলি সামঞ্জস্য করতে পারেন বা ফিল্টার করার জন্য অন্যান্য সূচক যুক্ত করতে পারেন।
৬০ মিনিটের ওভার শর্ট লাইন অপারেশন পদ্ধতিটি খুব উগ্র হতে পারে এবং উচ্চতর ওঠানামার জন্য উপযুক্ত নয়। স্টপ টাইমগুলি যথাযথভাবে সামঞ্জস্য করা যেতে পারে বা মোবাইল স্টপ লস ব্যবহার করে অপ্টিমাইজ করা যেতে পারে।
বড় ধরনের ম্যাক্রো ইকোনমিক ইভেন্টের সময় বাজারে আঘাত হানার ঝুঁকি বিবেচনা না করেই। এই সময়ে, কৌশলটি স্থগিত করা উচিত এবং বাজার স্থিতিশীল হওয়ার পরে ট্রেডিং চালিয়ে যাওয়া উচিত।
কৌশল অপ্টিমাইজেশনের দিকনির্দেশনা
বিভিন্ন প্যারামিটার সমন্বয় পরীক্ষা করা যেতে পারে, যেমন মোফি সূচক দৈর্ঘ্য সামঞ্জস্য করা, এসএমএ চক্রের প্যারামিটারগুলি অপ্টিমাইজ করা ইত্যাদি।
BOLL চ্যানেল, KD চ্যানেল ইত্যাদির মতো অন্যান্য সূচক যুক্ত করে দেখুন এবং দেখুন যে এটি সংকেতের নির্ভুলতা বাড়াতে পারে কিনা।
স্টপ লস-এর মাত্রা যথাযথভাবে শিথিল করে পরীক্ষা করা হয়, যাতে একক মুনাফা বাড়ানো যায় কিনা।
এই কৌশলগত কাঠামোর উপর ভিত্তি করে অন্যান্য চক্রের জন্য সংস্করণ তৈরি করার চেষ্টা করুন, যেমন 15 মিনিটের বা 30 মিনিটের সংস্করণ।
সারসংক্ষেপ
এই কৌশলটি সামগ্রিকভাবে খুব সংক্ষিপ্ত এবং সহজেই বোঝা যায়, মূল ধারণাটি ক্লাসিক ট্র্যাকিং ওভারকিং ওভারকিংয়ের সাথে সামঞ্জস্যপূর্ণ। মোফি সূচক ওভারকিং ওভারসোলিংয়ের মূল পয়েন্টগুলি সনাক্ত করে, কে-লাইন এন্ট্রি ফিল্টারিংয়ের সাথে কাজ করে, অনেক শব্দ ফিল্টার করা যায়। এসএমএ ফিল্টার যুক্ত করা কৌশলটির স্থায়িত্বকে আরও উন্নত করে।
৬০ মিনিটের ওভার-শর্ট-লাইন অপারেশন পদ্ধতি দ্রুত লাভের সাথে সাথে উচ্চতর অপারেশনাল ঝুঁকিও নিয়ে আসে। সামগ্রিকভাবে, এটি একটি খুব কার্যকর যুদ্ধের মূল্যবান পরিমাণগত কৌশল টেমপ্লেট, যা গভীর গবেষণা এবং অপ্টিমাইজেশনের জন্য মূল্যবান এবং আমাদের জন্য মূল্যবান কৌশল বিকাশের ধারণা সরবরাহ করে।
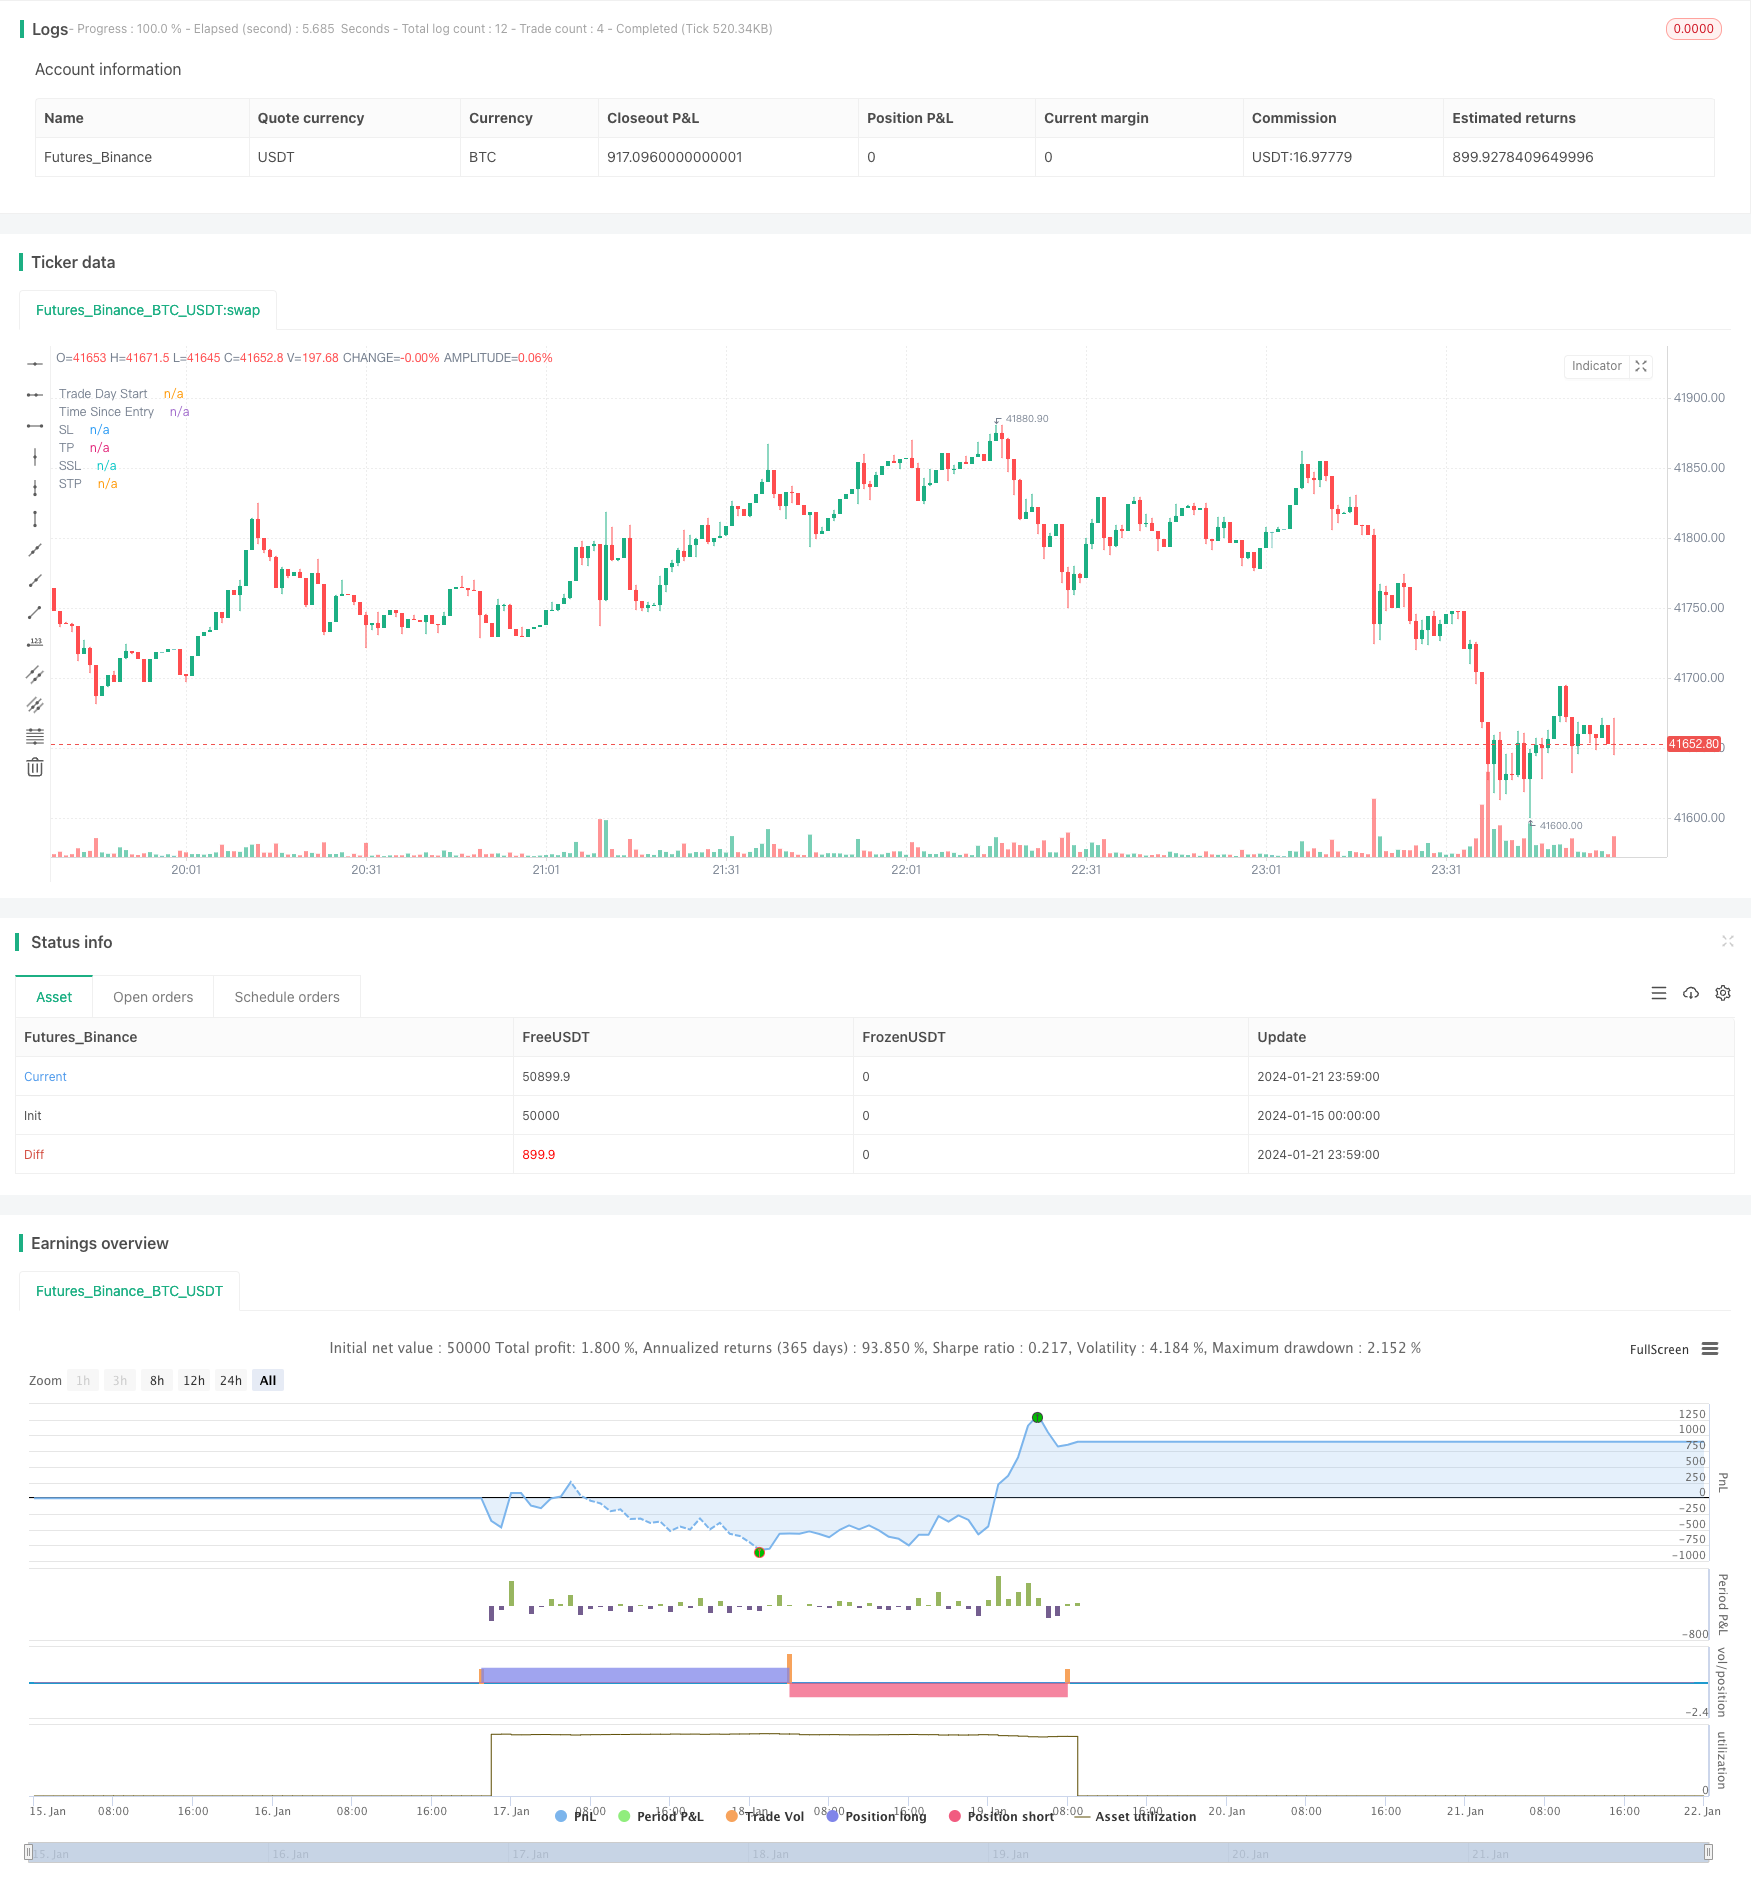
/*backtest
start: 2024-01-15 00:00:00
end: 2024-01-22 00:00:00
period: 1m
basePeriod: 1m
exchanges: [{"eid":"Futures_Binance","currency":"BTC_USDT"}]
*/

// This source code is subject to the terms of the Mozilla Public License 2.0 at https://mozilla.org/MPL/2.0/

// From "Crypto Day Trading Strategy" PDF file.

// * I'm using a SMA filter to avoid buying when the price is declining. Time frame was better at 15 min according to my test.

// 1 - Apply the 3 period Money Flow Index indicator to the 5 minute chart, using 0 and 100 as our oversold and overbought boundaries
// 2 - Wait for the MFI to reach overbought levels, that indicates the presence of "big sharks" in the market. Price needs to hold up
// the first two MFI overbought occurrences of the day to be considered as a bullish entry signal.*
// 3 - We buy when the MFI = 100 and the next candle is a bullish candle with short wicks.
// 4 - We place our Stop Loss below the low of the trading day and we Take Profit during the first 60 minutes after taking the trade.

// The logic above can be used in a mirrored fashion to take short entries, this is a custom parameter that can be modified from
// the strategy Inputs panel.

// © tweakerID

//@version=4
strategy("Money Flow Index 5 min Strategy",
     overlay=true )

direction = input(0, title = "Strategy Direction", type=input.integer, minval=-1, maxval=1)
strategy.risk.allow_entry_in(direction == 0 ? strategy.direction.all : (direction < 0 ? strategy.direction.short : strategy.direction.long))

/////////////////////// STRATEGY INPUTS ////////////////////////////////////////
title1=input(true, "-----------------Strategy Inputs-------------------")

i_MFI = input(3, title="MFI Length")
OB=input(100, title="Overbought Level")
OS=input(0, title="Oversold Level")
barsizeThreshold=input(.5, step=.05, minval=.1, maxval=1, title="Bar Body Size, 1=No Wicks")
i_MAFilter = input(true, title="Use MA Trend Filter")
i_MALen = input(80, title="MA Length")
i_timedexit=input(false, title="Use 60 minutes exit rule")
short=input(true, title="Use Mirrored logic for Shorts")

/////////////////////// BACKTESTER /////////////////////////////////////////////
title2=input(true, "-----------------General Inputs-------------------")

// Backtester General Inputs
i_SL=input(true, title="Use Stop Loss and Take Profit")
i_SLType=input(defval="Strategy Stop", title="Type Of Stop", options=["Strategy Stop", "Swing Lo/Hi", "ATR Stop"])
i_SPL=input(defval=10, title="Swing Point Lookback")
i_PercIncrement=input(defval=3, step=.1, title="Swing Point SL Perc Increment")*0.01
i_ATR = input(14, title="ATR Length")
i_ATRMult = input(5, step=.1, title="ATR Multiple")
i_TPRRR = input(2.2, step=.1, title="Take Profit Risk Reward Ratio")
TS=input(false, title="Trailing Stop")

// Bought and Sold Boolean Signal
bought = strategy.position_size > strategy.position_size[1]
 or strategy.position_size < strategy.position_size[1]

// Price Action Stop and Take Profit
LL=(lowest(i_SPL))*(1-i_PercIncrement)
HH=(highest(i_SPL))*(1+i_PercIncrement)
LL_price = valuewhen(bought, LL, 0)
HH_price = valuewhen(bought, HH, 0)
entry_LL_price = strategy.position_size > 0 ? LL_price : na
entry_HH_price = strategy.position_size < 0 ? HH_price : na
tp=strategy.position_avg_price + (strategy.position_avg_price - entry_LL_price)*i_TPRRR
stp=strategy.position_avg_price - (entry_HH_price - strategy.position_avg_price)*i_TPRRR

// ATR Stop
ATR=atr(i_ATR)*i_ATRMult
ATRLong = ohlc4 - ATR
ATRShort = ohlc4 + ATR
ATRLongStop = valuewhen(bought, ATRLong, 0)
ATRShortStop = valuewhen(bought, ATRShort, 0)
LongSL_ATR_price = strategy.position_size > 0 ? ATRLongStop : na
ShortSL_ATR_price = strategy.position_size < 0 ? ATRShortStop : na
ATRtp=strategy.position_avg_price + (strategy.position_avg_price - LongSL_ATR_price)*i_TPRRR
ATRstp=strategy.position_avg_price - (ShortSL_ATR_price - strategy.position_avg_price)*i_TPRRR


// Strategy Stop
DayStart = time == timestamp("UTC", year, month, dayofmonth, 0, 0, 0)
plot(DayStart ? 1e9 : na, style=plot.style_columns, color=color.silver, transp=80, title="Trade Day Start")
float LongStop = valuewhen(DayStart,low,0)*(1-i_PercIncrement)
float ShortStop = valuewhen(DayStart,high,0)*(1+i_PercIncrement)
float StratTP = strategy.position_avg_price + (strategy.position_avg_price - LongStop)*i_TPRRR
float StratSTP = strategy.position_avg_price - (ShortStop - strategy.position_avg_price)*i_TPRRR

/////////////////////// STRATEGY LOGIC /////////////////////////////////////////

MFI=mfi(close,i_MFI)
barsize=high-low
barbodysize=close>open?(open-close)*-1:(open-close)
shortwicksbar=barbodysize>barsize*barsizeThreshold
SMA=sma(close, i_MALen)
MAFilter=close > SMA
timesinceentry=(time - valuewhen(bought, time, 0)) / 60000
timedexit=timesinceentry == 60

BUY = MFI[1] == OB and close > open and shortwicksbar and (i_MAFilter ? MAFilter : true)
bool SELL = na
if short
    SELL := MFI[1] == OS and close < open and shortwicksbar and (i_MAFilter ? not MAFilter : true)

//Debugging Plots
plot(timesinceentry, transp=100, title="Time Since Entry")

//Trading Inputs
DPR=input(true, "Allow Direct Position Reverse")
reverse=input(false, "Reverse Trades")

// Entries
if reverse
    if not DPR
        strategy.entry("long", strategy.long, when=SELL and strategy.position_size == 0)
        strategy.entry("short", strategy.short, when=BUY and strategy.position_size == 0)
    else
        strategy.entry("long", strategy.long, when=SELL)
        strategy.entry("short", strategy.short, when=BUY)
else
    if not DPR
        strategy.entry("long", strategy.long, when=BUY and strategy.position_size == 0)
        strategy.entry("short", strategy.short, when=SELL and strategy.position_size == 0)
    else
        strategy.entry("long", strategy.long, when=BUY)
        strategy.entry("short", strategy.short, when=SELL)
if i_timedexit
    strategy.close_all(when=timedexit)

SL= i_SLType == "Swing Lo/Hi" ? entry_LL_price : i_SLType == "ATR Stop" ? LongSL_ATR_price : LongStop
SSL= i_SLType == "Swing Lo/Hi" ? entry_HH_price : i_SLType == "ATR Stop" ? ShortSL_ATR_price : ShortStop
TP= i_SLType == "Swing Lo/Hi" ? tp : i_SLType == "ATR Stop" ? ATRtp : StratTP
STP= i_SLType == "Swing Lo/Hi" ? stp : i_SLType == "ATR Stop" ? ATRstp : StratSTP

//TrailingStop
dif=(valuewhen(strategy.position_size>0 and strategy.position_size[1]<=0, high,0))
 -strategy.position_avg_price
trailOffset     = strategy.position_avg_price - SL
var tstop = float(na)
if strategy.position_size > 0
    tstop := high- trailOffset - dif
    if tstop<tstop[1]
        tstop:=tstop[1]
else
    tstop := na
StrailOffset     = SSL - strategy.position_avg_price
var Ststop = float(na)
Sdif=strategy.position_avg_price-(valuewhen(strategy.position_size<0
 and strategy.position_size[1]>=0, low,0))
if strategy.position_size < 0
    Ststop := low+ StrailOffset + Sdif
    if Ststop>Ststop[1]
        Ststop:=Ststop[1]
else
    Ststop := na

strategy.exit("TP & SL", "long", limit=TP, stop=TS? tstop : SL, when=i_SL)
strategy.exit("TP & SL", "short", limit=STP, stop=TS? Ststop : SSL, when=i_SL)

/////////////////////// PLOTS //////////////////////////////////////////////////

plot(i_SL and strategy.position_size > 0 and not TS ? SL : i_SL and strategy.position_size > 0 and TS ? tstop : na , title='SL', style=plot.style_cross, color=color.red)
plot(i_SL and strategy.position_size < 0 and not TS ? SSL : i_SL and strategy.position_size < 0 and TS ? Ststop : na , title='SSL', style=plot.style_cross, color=color.red)
plot(i_SL and strategy.position_size > 0 ? TP : na, title='TP', style=plot.style_cross, color=color.green)
plot(i_SL and strategy.position_size < 0 ? STP : na, title='STP', style=plot.style_cross, color=color.green)
// Draw price action setup arrows
plotshape(BUY ? 1 : na, style=shape.triangleup, location=location.belowbar,
 color=color.green, title="Bullish Setup", size=size.auto)
plotshape(SELL ? 1 : na, style=shape.triangledown, location=location.abovebar,
 color=color.red, title="Bearish Setup", size=size.auto)