গোল্ডেন ক্রস ট্রেডিং কৌশল
ওভারভিউ
ডাবল ইক্যুয়ালিটি ক্রস গোল্ডেন ক্রস ট্রেডিং কৌশলটি দুটি ভিন্ন পিরিয়ডের চলমান গড়ের ক্রসকে একটি কেনা এবং বিক্রি সংকেত হিসাবে ব্যবহার করে। বিশেষত, যখন স্বল্প-পিরিয়ডের চলমান গড়গুলি নীচের দিক থেকে দীর্ঘ-পিরিয়ডের চলমান গড়কে ভেঙে দেয়, তখন একটি গোল্ডেন ক্রস সংকেত উত্পন্ন হয়, যা একটি বুলের দিকে যায়; যখন স্বল্প-পিরিয়ডের চলমান গড়গুলি উপরের দিক থেকে দীর্ঘ-পিরিয়ডের চলমান গড়কে ভেঙে দেয়, তখন একটি মৃত ক্রস সংকেত উত্পন্ন হয়, যা একটি বিয়ারের দিকে যায়।
কৌশল নীতি
এই কৌশলটি দুটি নীতির উপর ভিত্তি করে তৈরি হয়েছেঃ
চলমান গড়গুলি বাজারের প্রবণতা এবং শক্তিকে প্রতিফলিত করে। সংক্ষিপ্ত সময়ের চলমান গড়গুলি বাজারের সাম্প্রতিক গতি এবং বিপর্যয়কে ক্যাপচার করে; দীর্ঘ সময়ের চলমান গড়গুলি বাজারের মূল প্রবণতা প্রদর্শন করে।
স্বল্পমেয়াদী চলমান গড় এবং দীর্ঘমেয়াদী চলমান গড়ের মধ্যে গোল্ডেন ক্রস গঠন করা হলে, স্বল্পমেয়াদী বাজারের শক্তি দীর্ঘমেয়াদী প্রবণতার শক্তিকে ছাড়িয়ে যায়, তাই নতুন উত্থান শুরু হওয়ার সম্ভাবনা রয়েছে। মৃত্যুর ক্রস গঠন করা হলে, দীর্ঘমেয়াদী পতনের প্রবণতা প্রাধান্য পায়, তাই এটি সম্ভবত অব্যাহত থাকবে।
বিশেষ করে, এই কৌশলটি 13 এবং 30 পিরিয়ডের একটি সরল চলমান গড় সেট করে এবং তাদের ক্রস করার সময় একটি ট্রেডিং সংকেত উত্পন্ন করে। ক্রসিংয়ের নীতিটি নিম্নরূপঃ
যখন একটি স্বল্পকালীন চলমান গড় একটি দীর্ঘকালীন চলমান গড় অতিক্রম করে, তখন একটি গোল্ডেন ক্রস সংকেত উত্পন্ন হয়, যা আরও বেশি করার সুযোগকে নির্দেশ করে। এই সময়ে, প্রবণতা দৃঢ়তা মূল্যায়ন করে প্রবেশ করুনঃ যদি দামগুলি একটি নির্দিষ্ট সময়ের বেশি সময় ধরে চলতে থাকে তবে এটি বিশ্বাসযোগ্য যে বর্তমানটি একটি উচ্চতর প্রবণতা, তবে আরও বেশি করুন।
যখন একটি স্বল্পমেয়াদী চলমান গড় দীর্ঘমেয়াদী চলমান গড়ের নীচে অতিক্রম করে, তখন একটি মৃত ক্রস সংকেত উত্পন্ন হয়, যা একটি shortcut সুযোগ নির্দেশ করে। এই সময়ে, প্রবণতা দৃঢ়তা মূল্যায়ন করে প্রবেশ করুনঃ যদি দাম একটি নির্দিষ্ট সময়কালের চেয়ে বেশি সময় ধরে থাকে, তবে এটি নিশ্চিত যে বর্তমানটি একটি নিম্নমুখী প্রবণতা, তাহলে shortcut করুন।
ক্রস সিগন্যালের তীব্রতা পরিমাপ করা হয় চলমান গড়ের ঢালের মাধ্যমে। ক্রস সিগন্যালকে প্রবেশের জন্য যথেষ্ট শক্তিশালী বলে বিবেচনা করা হয় কেবলমাত্র যখন স্বল্পমেয়াদী এবং দীর্ঘমেয়াদী চলমান গড়ের ঢাল একটি নির্দিষ্ট থ্রেশহোল্ডের চেয়ে বড় হয়। এটি সাধারণ মিথ্যা সংকেতের হস্তক্ষেপকে বাধা দেয়।
স্টপ লস 20% এবং স্টপ আউট 100%।
সামর্থ্য বিশ্লেষণ
ডাবল ইয়ারলাইন ক্রস কৌশলটি নিম্নলিখিত সুবিধাগুলি নিয়ে আসেঃ
এটি সহজ, সহজেই বোঝা যায় এবং বাস্তবায়িত হয়, নতুনদের জন্য উপযুক্ত।
দামের গড় বৈশিষ্ট্য ব্যবহার করে, একটি নির্দিষ্ট আওয়াজ কমানোর প্রভাব রয়েছে, যা স্বল্পমেয়াদী মূল্যের ওঠানামা দ্বারা বিভ্রান্ত হওয়া এড়াতে পারে।
ট্রেন্ডের দৃঢ়তা মূল্যায়ন করুন, যান্ত্রিকভাবে অতিরিক্ত শূন্যতা এড়িয়ে চলুন, বরং বড় দালাল বিচার করুন।
স্লাইডিং এভারেজ মোশন ফ্যাক্টর যুক্ত করা হয়েছে, যা সিগন্যালকে আরো নির্ভরযোগ্য করে তোলে।
রিটার্ন অপ্টিমাইজেশন সহজ, শুধুমাত্র কয়েকটি মূল প্যারামিটার যেমন চলমান গড় প্যারামিটার এবং প্রবণতা দৃঢ়তা সময়কে সামঞ্জস্য করতে হবে।
ঝুঁকি বিশ্লেষণ
এই কৌশলটি নিম্নলিখিত ঝুঁকিগুলিও বহন করেঃ
ডাবল-ইউনিওগ্রাফিক ক্রস এখনও একটি বিলম্বিত সংকেত, একটি বিপরীত দিকের পূর্বাভাস দেওয়া অসম্ভব, একটি নির্দিষ্ট পরিমাণে বিলম্ব রয়েছে। চলমান গড়ের সময়কাল যথাযথভাবে সংক্ষিপ্ত করা উচিত, বা বিপরীত দিকের পূর্বাভাস দেওয়ার জন্য ফ্যাক্টরগুলির সাথে ব্যবহার করা উচিত।
যান্ত্রিক লেনদেনের সিস্টেমগুলি একসাথে আক্রমণের জন্য সহজ, যার ফলে লেনদেনের মাত্রা বাড়িয়ে দেয়, যা ক্ষতি বা বাধাকে অকার্যকর করে দেয়। একটি সিঁড়িযুক্ত ক্ষতি প্রতিরোধক বা যথাযথভাবে হস্তক্ষেপ করা উচিত।
এই ধরনের চক্রের মধ্যে বারবার তির্যক প্রজাতি এড়ানো উচিত, পরিষ্কার দিকনির্দেশের প্রজাতি বেছে নিয়ে ট্রেড করা উচিত।
প্রবণতা দৃঢ়তা মূল্যায়ন করার জন্য একটি সময় উইন্ডো সেট করা হয় যখন ফলাফলের উপর একটি বড় প্রভাব আছে কিনা তা নির্ধারণ করার জন্য সর্বোত্তম মান নির্ধারণের জন্য পুনরাবৃত্তিমূলক পরীক্ষা করা হয়।
অপ্টিমাইজেশান দিক
ডাবল-ইউনিভার্সাল ক্রসিং কৌশলটি নিম্নলিখিত দিকগুলি থেকে অপ্টিমাইজ করা যেতে পারেঃ
বড় আকারের প্রবণতা মূল্যায়নের জন্য সূচক যোগ করা, বিপরীতমুখী অপারেশন এড়ানো। যেমন তুলনামূলক বৃত্ত বা চাঁদের লাইনের অবস্থান যোগ করা।
ট্রেডিং ভলিউম যাচাইকরণ যোগ করুন, কেবলমাত্র ট্রেডিং ভলিউম বাড়ানোর ক্ষেত্রে সংকেত প্রেরণ করুন, ভুয়া সংকেত এড়াতে।
চলমান গড় প্যারামিটারগুলিকে অনুকূলিত করুন এবং সর্বোত্তম সময়কালের সমন্বয় খুঁজুন। আপনি চলমান গড় প্যারামিটারগুলিকে স্বতঃস্ফূর্ত করার চেষ্টা করতে পারেন।
মেজর ফর্মুলা ইন্ডিকেটর যেমন MACD, KD ইত্যাদির সাহায্যে সিগন্যালের নির্ভুলতা বাড়ানো।
সিঁড়িযুক্ত ক্ষতি প্রতিরোধক সেট করুন, ঝুঁকি নিয়ন্ত্রণের জন্য আরও ভাল।
সারসংক্ষেপ
ডাবল-ইউনিফর্মার ক্রস কৌশলটি সামগ্রিকভাবে একটি খুব স্বজ্ঞাত এবং ব্যাখ্যাযোগ্য কৌশলগত ধারণা। এটি চলমান গড়ের শব্দহীনতার বৈশিষ্ট্যগুলিকে ক্রস-নির্ধারণের সহজ প্রবণতা সনাক্তকরণের ক্ষমতার সাথে একত্রিত করে। একই সাথে, সংকেতগুলির কিছু যাচাইকরণ করা হয়, অন্ধভাবে অনুসরণ করা এড়ানো হয়, যা এর ব্যবহারিকতা এবং স্থিতিশীলতা বাড়িয়ে তোলে। এই নিবন্ধে উল্লিখিত কয়েকটি উন্নতির কৌশল ছাড়াও, এই কৌশলটি এখনও অপ্টিমাইজ করার জন্য প্রচুর জায়গা রয়েছে এবং এটি আরও গভীরভাবে অধ্যয়নের জন্য উপযুক্ত।
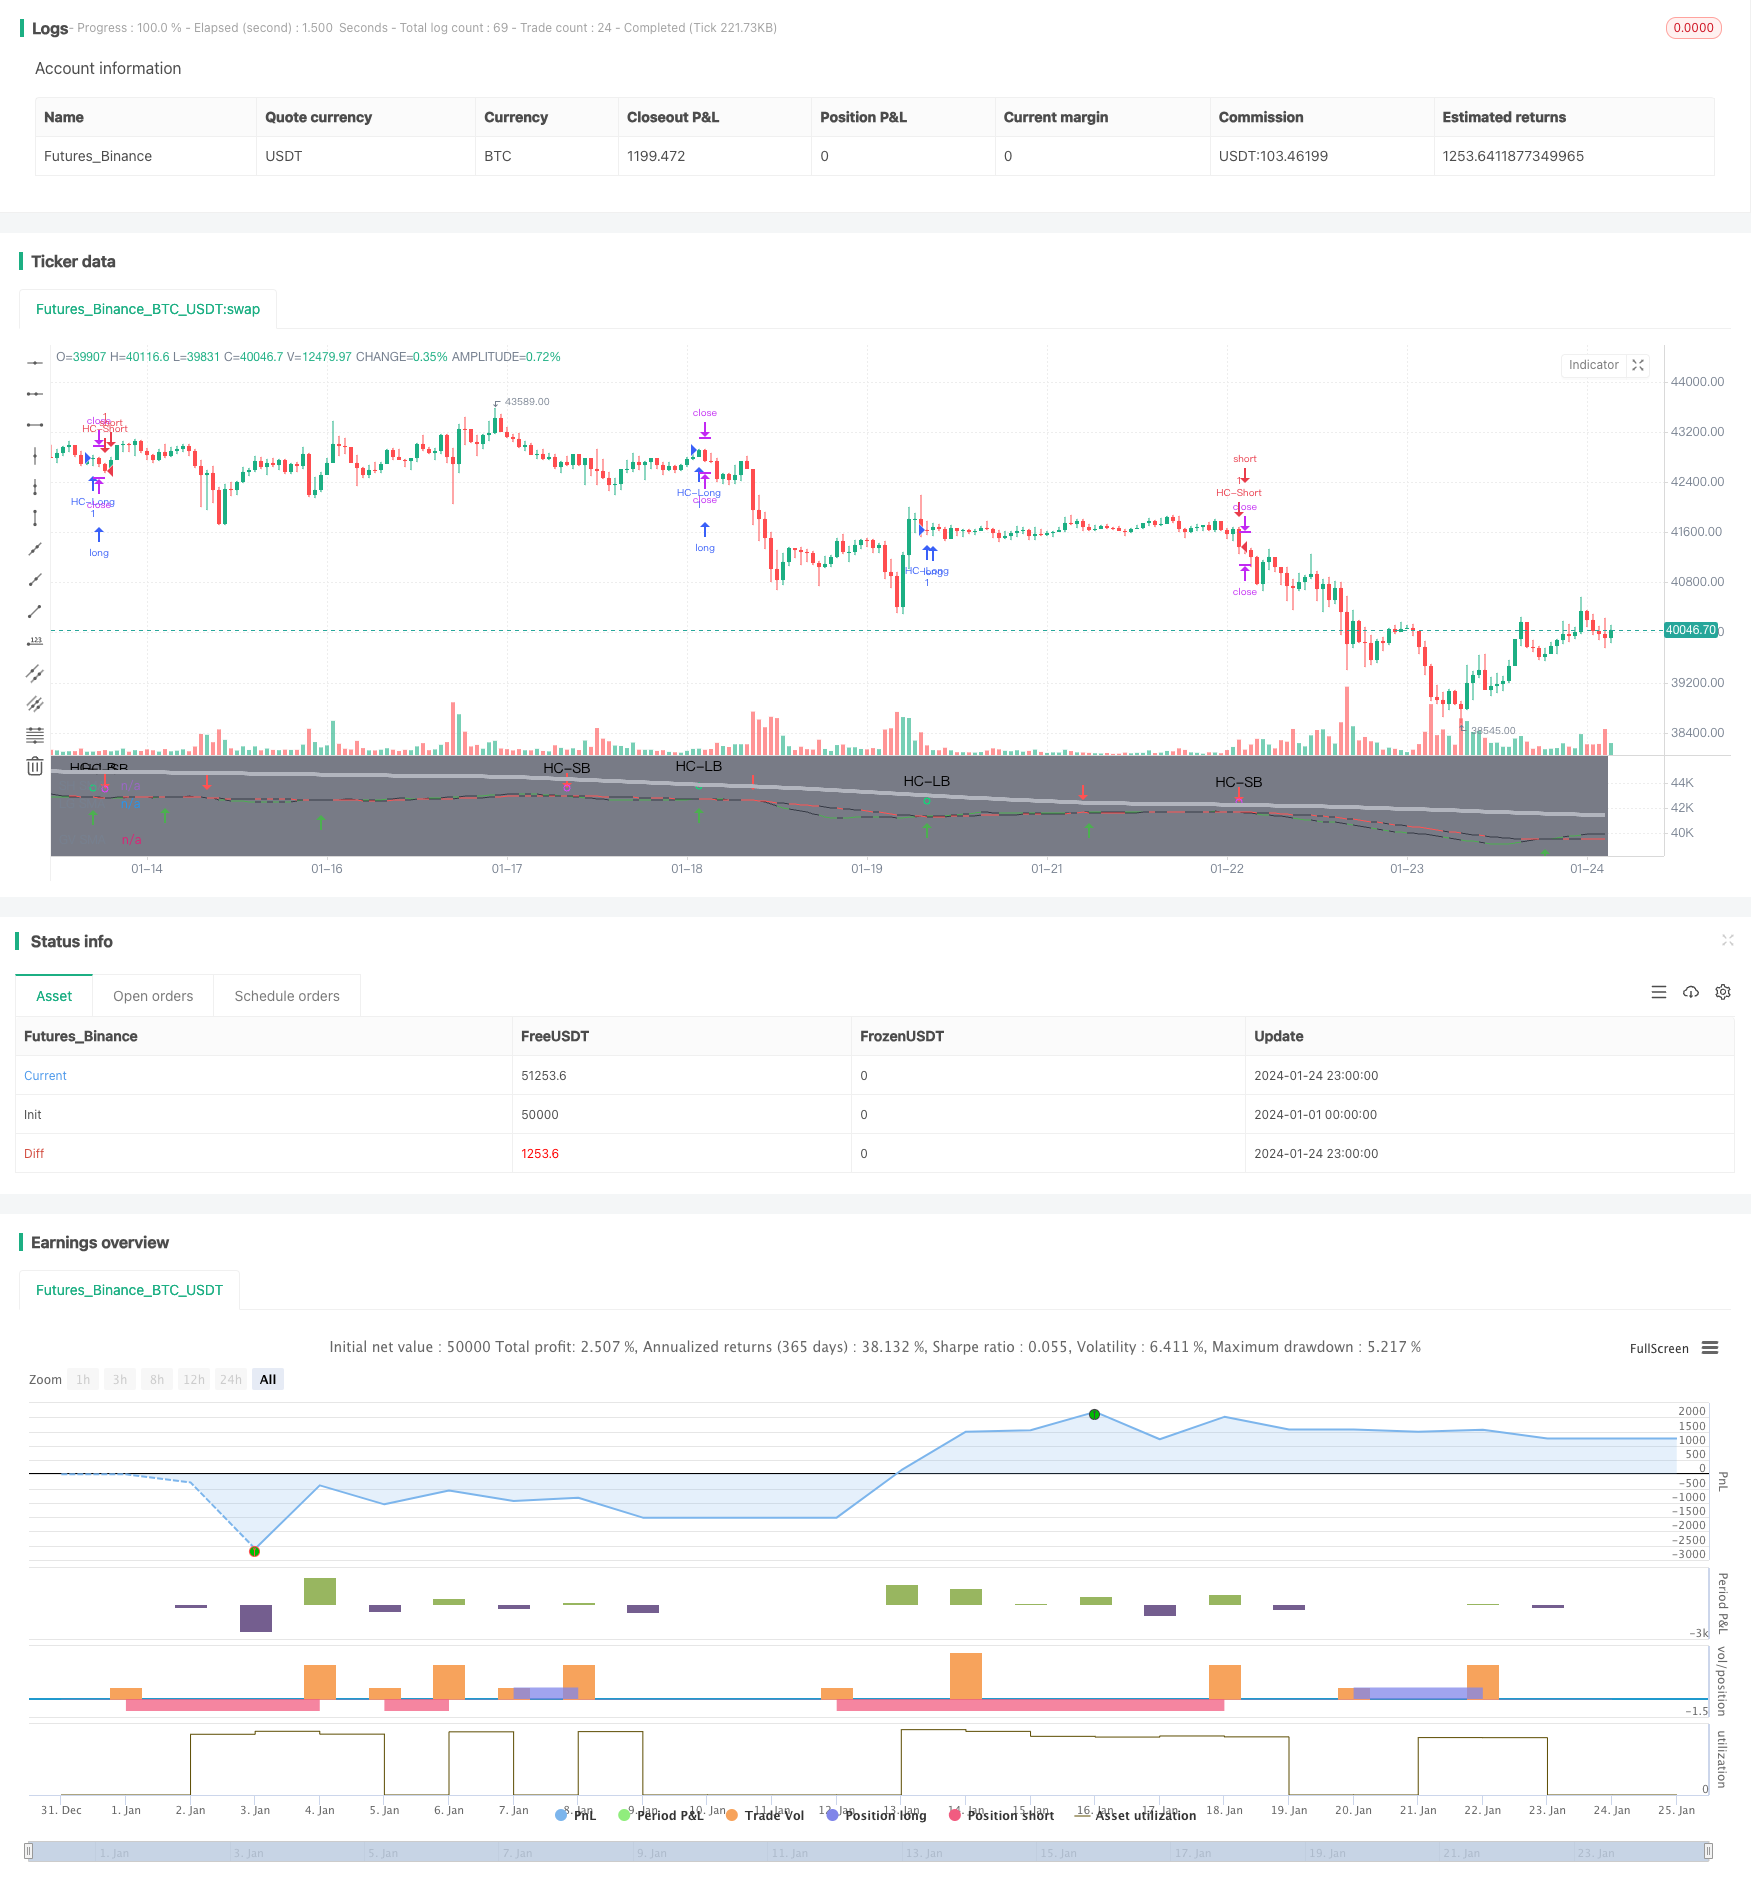
/*backtest
start: 2024-01-01 00:00:00
end: 2024-01-25 00:00:00
period: 1h
basePeriod: 15m
exchanges: [{"eid":"Futures_Binance","currency":"BTC_USDT"}]
*/

//@version=4

// This source code is subject to the terms of the Mozilla Public License 2.0 at https://mozilla.org/MPL/2.0/
// © MakeMoneyCoESTB2020


//*********************Notes for continued work***************

//************************************************************

//Hello my fellow investors
//I am creating a simple non-cluttered strategy that uses 3(+1) simple means to determine: viability, entry, and exit
//1) Has a consistent trend been maintained for several days/weeks
//2) SH SMA crossover LG SMA = Bullish entry/LG SMA crossover SH SMA = Bearish entry
//3) Use the Slope factor & Weeks in Trend (WiT) to dertermine how strong of an entry signal you are comfortable with
//4) Exit position based on next SMA cross and trend reversal or stop loss%
//3+1) For added confidence in trend detection: Apply MACD check - buy--> MACD line above signal line and corssover below histogram \\ sell --> MACD line below signal line and crossover above histogram.
//*)This code also allows you to determine your desired backtesting date compliments of alanaster


//This code is the product of many hours of hard work on the part of the greater tradingview community.  The credit goes to everyone in the community who has put code out there for the greater good.

//Happy Hunting!

// 1. Define strategy settings*************************************************************************************************************************************************************************

//Title
strategy("KISS Strategy: SMA + EMA", shorttitle="KISS Strat")

//define calculations price source
price = input(title="Price Source", defval=close)

// 2. Calculate strategy values*************************************************************************************************************************************************************************

//Calculate 13/30/200SMA
SH_SMA_length= input(title="SH SMA Length", defval=13) //short SMA length
LG_SMA_length= input(title="LG SMA Length", defval=30) //long SMA length
GV_SMA_length= input(title="SH SMA Length", defval=200) //Gravitational SMA length

SH_SMA=sma(price, SH_SMA_length) //short SMA
LG_SMA=sma(price, LG_SMA_length) //long SMA
GV_SMA=sma(price, GV_SMA_length) //gravitational SMA

//calculate MACD
//define variables for speed
fast = 12, slow = 26
//define parameters to calculate MACD
fastMA = ema(price, fast)
slowMA = ema(price, slow)
//define MACD line
macd = fastMA - slowMA
//define SIGNAL line
signal = sma(macd, 9)

//Determine what type of trend we are in
dcp = security(syminfo.tickerid, 'D', close)   //daily close price
wcp = security(syminfo.tickerid, 'W', close)   //weekly close price

WiT = input(title="Weeks In Trend", defval=1, maxval=5, minval=1)    //User input for how many weeks of price action to evaluate (Weeks in Trend = WiT)
BearTrend = false       //initialize trend variables as false
BullTrend = false       //initialize trend variables as false

// BullTrend := (wcp > SH_SMA) and (SH_SMA > LG_SMA)  //true if price is trending up based on weekly price close
// BearTrend := (wcp < SH_SMA) and (SH_SMA < LG_SMA)  //true if price is trending down based on weekly price close


// BullTrend := (price > SH_SMA) and (SH_SMA > LG_SMA)  //true if price is trending up
// BearTrend := (price < SH_SMA) and (SH_SMA < LG_SMA)  //true if price is trending down

//Determine if the market has been in a trend for 'n' weeks

n=WiT                           //create loop internal counting variable
for i=1 to WiT                  //create loop to determine if BearTrend=true to set number of weeks
    if (wcp[n] < price)         //evaluate if BearTrend=false comparing the current price to a paticular week close
        BearTrend := false      //set value to false if older price value is less than newer: trending up
        break                   //break out of for loop when trend first falters
    if (wcp[n] > price)         //evaluate if BearTrend=true comparing the current price to a paticular week close
        BearTrend := true       //set value to true if older price value is greater than newer: trending down
    n:=n-1                      //set internal counter one day closer to present

m=WiT                           //create loop internal counting variable
for j=1 to WiT                  //create loop to determine if BearTrend=true to set number of weeks
    if (wcp[m] > price)         //evaluate if BullTrend=false comparing the current price to a paticular week close
        BullTrend := false      //set value to false if older price value is greater than newer: trending down
        break                   //break out of for loop when trend first falters
    if (wcp[m] < price)         //evaluate if BullTrend=true comparing the current price to a paticular week close
        BullTrend := true       //set value to true if older price value is less than newer: trending up
    m:=m-1                      //set internal counter one day closer to present


//Determine if crossings occur
SH_LGcrossover = crossover(SH_SMA, LG_SMA)  //returns true if short crosses over long
SH_LGcrossunder = crossunder(SH_SMA, LG_SMA)    //returns true if short crosses under long

//Determine the slope of the SMAs when a cross over occurs
SlopeFactor= input(title="Slope Factor", defval=.01, minval=0, step = 0.001) //user input variable for what slope to evaluate against
XSlopeSH = abs(SH_SMA-SH_SMA[2]) //slope of short moving average (time cancels out)
XSlopeLG = abs(LG_SMA-LG_SMA[2]) //slope of long moving average (time cancels out)
StrongSlope = iff (abs(XSlopeSH-XSlopeLG)>SlopeFactor, true, false) //create a boolean variable to determine is slope intensity requirement is met

// ************************************ INPUT BACKTEST RANGE ******************************************=== coutesy of alanaster
fromMonth = input(defval = 4,    title = "From Month",      type = input.integer, minval = 1, maxval = 12)
fromDay   = input(defval = 1,    title = "From Day",        type = input.integer, minval = 1, maxval = 31)
fromYear  = input(defval = 2020, title = "From Year",       type = input.integer, minval = 1970)
thruMonth = input(defval = 1,    title = "Thru Month",      type = input.integer, minval = 1, maxval = 12)
thruDay   = input(defval = 1,    title = "Thru Day",        type = input.integer, minval = 1, maxval = 31)
thruYear  = input(defval = 2112, title = "Thru Year",       type = input.integer, minval = 1970)

// === INPUT SHOW PLOT ===
showDate  = input(defval = true, title = "Show Date Range", type = input.bool)

// === FUNCTION EXAMPLE ===
start     = timestamp(fromYear, fromMonth, fromDay, 00, 00)        // backtest start window
finish    = timestamp(thruYear, thruMonth, thruDay, 23, 59)        // backtest finish window
window()  => true

bgcolor(color = showDate and window() ? color.gray : na, transp = 90)
// === EXECUTION ===
//strategy.entry("L", strategy.long, when = window() and crossOv)    // enter long when "within window of time" AND crossover
//strategy.close("L", when = window() and crossUn)                   // exit long when "within window of time" AND crossunder

// 3. Output strategy data*************************************************************************************************************************************************************************

//Embolden line if a trend exists
trendcolorLG = BearTrend?color.red:color.black //highlights beartrend condition met graphically
trendcolorSH = BullTrend?color.green:color.black //highlights beartrend condition met graphically

//plot SMAs
plot(SH_SMA, title = "SH SMA", color = trendcolorSH)
plot(LG_SMA, title = "LG SMA", color = trendcolorLG)
plot(GV_SMA, title = "GV SMA", color = color.silver, linewidth = 4, transp = 70)

//Highlight crossovers
plotshape(series=SH_LGcrossover, style=shape.arrowup, location=location.belowbar,size=size.normal, color=color.green)
plotshape(series=SH_LGcrossunder, style=shape.arrowdown, location=location.abovebar,size=size.normal, color=color.red)

// 4. Determine Long & Short Entry Calculations*************************************************************************************************************************************************************************

//Define countback variable
countback=input(minval=0, maxval=5, title="Price CountBack", defval=0)
//User input for what evaluations to run: SMA or SMA + EMA
SMA_Y_N=input(defval = "Y", title="Run SMA", type=input.string, options=["Y", "N"])
MACD_Y_N=input(defval = "N", title="Run MACD", type=input.string, options=["Y", "N"])

//Calculate SMA Cross entry conditions
SMAbuy=false
SMAsell=false
SMAbuy := SH_LGcrossover and StrongSlope and BearTrend[WiT*7]   //enter long if short SMA crosses over long SMA & security has been in a BearTrend for 'n' days back
SMAsell := SH_LGcrossunder and StrongSlope and BullTrend[WiT*7] //enter short if short SMA crosses under long SMA & security has been in a BullTrend for 'n' days back

//Calculate MACD Cross entry conditions
MACDbuy = iff(MACD_Y_N=="Y", crossunder(signal[countback], macd[countback]), true) and iff(MACD_Y_N=="Y", macd[countback]<0, true) and StrongSlope and BearTrend     //enter long if fast MACD crosses over slow MACD & there is a strong slope & security has been in a BearTrend for 'n' days back
MACDsell = iff(MACD_Y_N=="Y", crossunder(macd[countback], signal[countback]), true) and iff(MACD_Y_N=="Y", signal[countback]>0, true) and StrongSlope and BullTrend  //enter short if fast MACD crosses under slow MACD & there is a strong slope & security has been in a BullTrend for 'n' days back

//long entry condition
dataHCLB=(iff(SMA_Y_N=="Y", SMAbuy, true) and iff(MACD_Y_N=="Y", MACDbuy, true))
plotshape(dataHCLB, title= "HC-LB", color=color.lime, style=shape.circle, text="HC-LB")
strategy.entry("HC-Long", strategy.long, comment="HC-Long", when = dataHCLB and window())

//short entry condition
dataHCSB=(iff(SMA_Y_N=="Y", SMAsell, true) and iff(MACD_Y_N=="Y", MACDsell, true))
plotshape(dataHCSB, title= "HC-SB", color=color.fuchsia, style=shape.circle, text="HC-SB")
strategy.entry("HC-Short", strategy.short, comment="HC-Short", when=dataHCSB and window())


// 5. Submit Profit and Loss Exit Calculations Orders*************************************************************************************************************************************************************************

// User Options to Change Inputs (%)
stopPer = input(12, title='Stop Loss %', type=input.float) / 100
takePer = input(25, title='Take Profit %', type=input.float) / 100

// Determine where you've entered and in what direction
longStop = strategy.position_avg_price * (1 - stopPer)
shortStop = strategy.position_avg_price * (1 + stopPer)
shortTake = strategy.position_avg_price * (1 - takePer)
longTake = strategy.position_avg_price * (1 + takePer)

//exit position conditions and orders
if strategy.position_size > 0//or crossunder(price[countback], upperBB)
    strategy.exit(id="Close Long", when = window(), stop=longStop, limit=longTake)
if strategy.position_size < 0 //or crossover(price[countback], lowerBB)
    strategy.exit(id="Close Short", when = window(), stop=shortStop, limit=shortTake)


//Evaluate/debug equation***************************************************************************************************************************************************************************
// plotshape((n==5? true : na), title='n=5', style=shape.labeldown, location=location.abovebar, text='5', color=color.white, textcolor=color.black, transp=0) //print n value if 5
// plotshape((n==4? true : na), title='n=4', style=shape.labeldown, location=location.abovebar, text='4', color=color.white, textcolor=color.black, transp=0) //print n value if 4
// plotshape((n==3? true : na), title='n=3', style=shape.labeldown, location=location.abovebar, text='3', color=color.white, textcolor=color.black, transp=0) //print n value if 3
// plotshape((n==2? true : na), title='n=2', style=shape.labeldown, location=location.abovebar, text='2', color=color.white, textcolor=color.black, transp=0) //print n value if 2
// plotshape((n==1? true : na), title='n=1', style=shape.labeldown, location=location.abovebar, text='1', color=color.white, textcolor=color.black, transp=0) //print n value if 1
// lineValue = 11                                           //set random visible line value to check when equation is true
// colorP = (BearTrend==true) ? color.green : color.red
// plot (lineValue, title = "BearTrend", color = colorP)   //Plot when condition true=green, false=red
// plot (XSlopeLG+15, color=color.white) //used for code debugging
// plot (XSlopeSH+15, color=color.blue) //used for code debugging
// plot (abs(XSlopeSH-XSlopeLG)+20, color=color.fuchsia) //used for code debugging