ডাবল এমএ মোমেন্টাম ব্রেকআউট কৌশল
ওভারভিউ
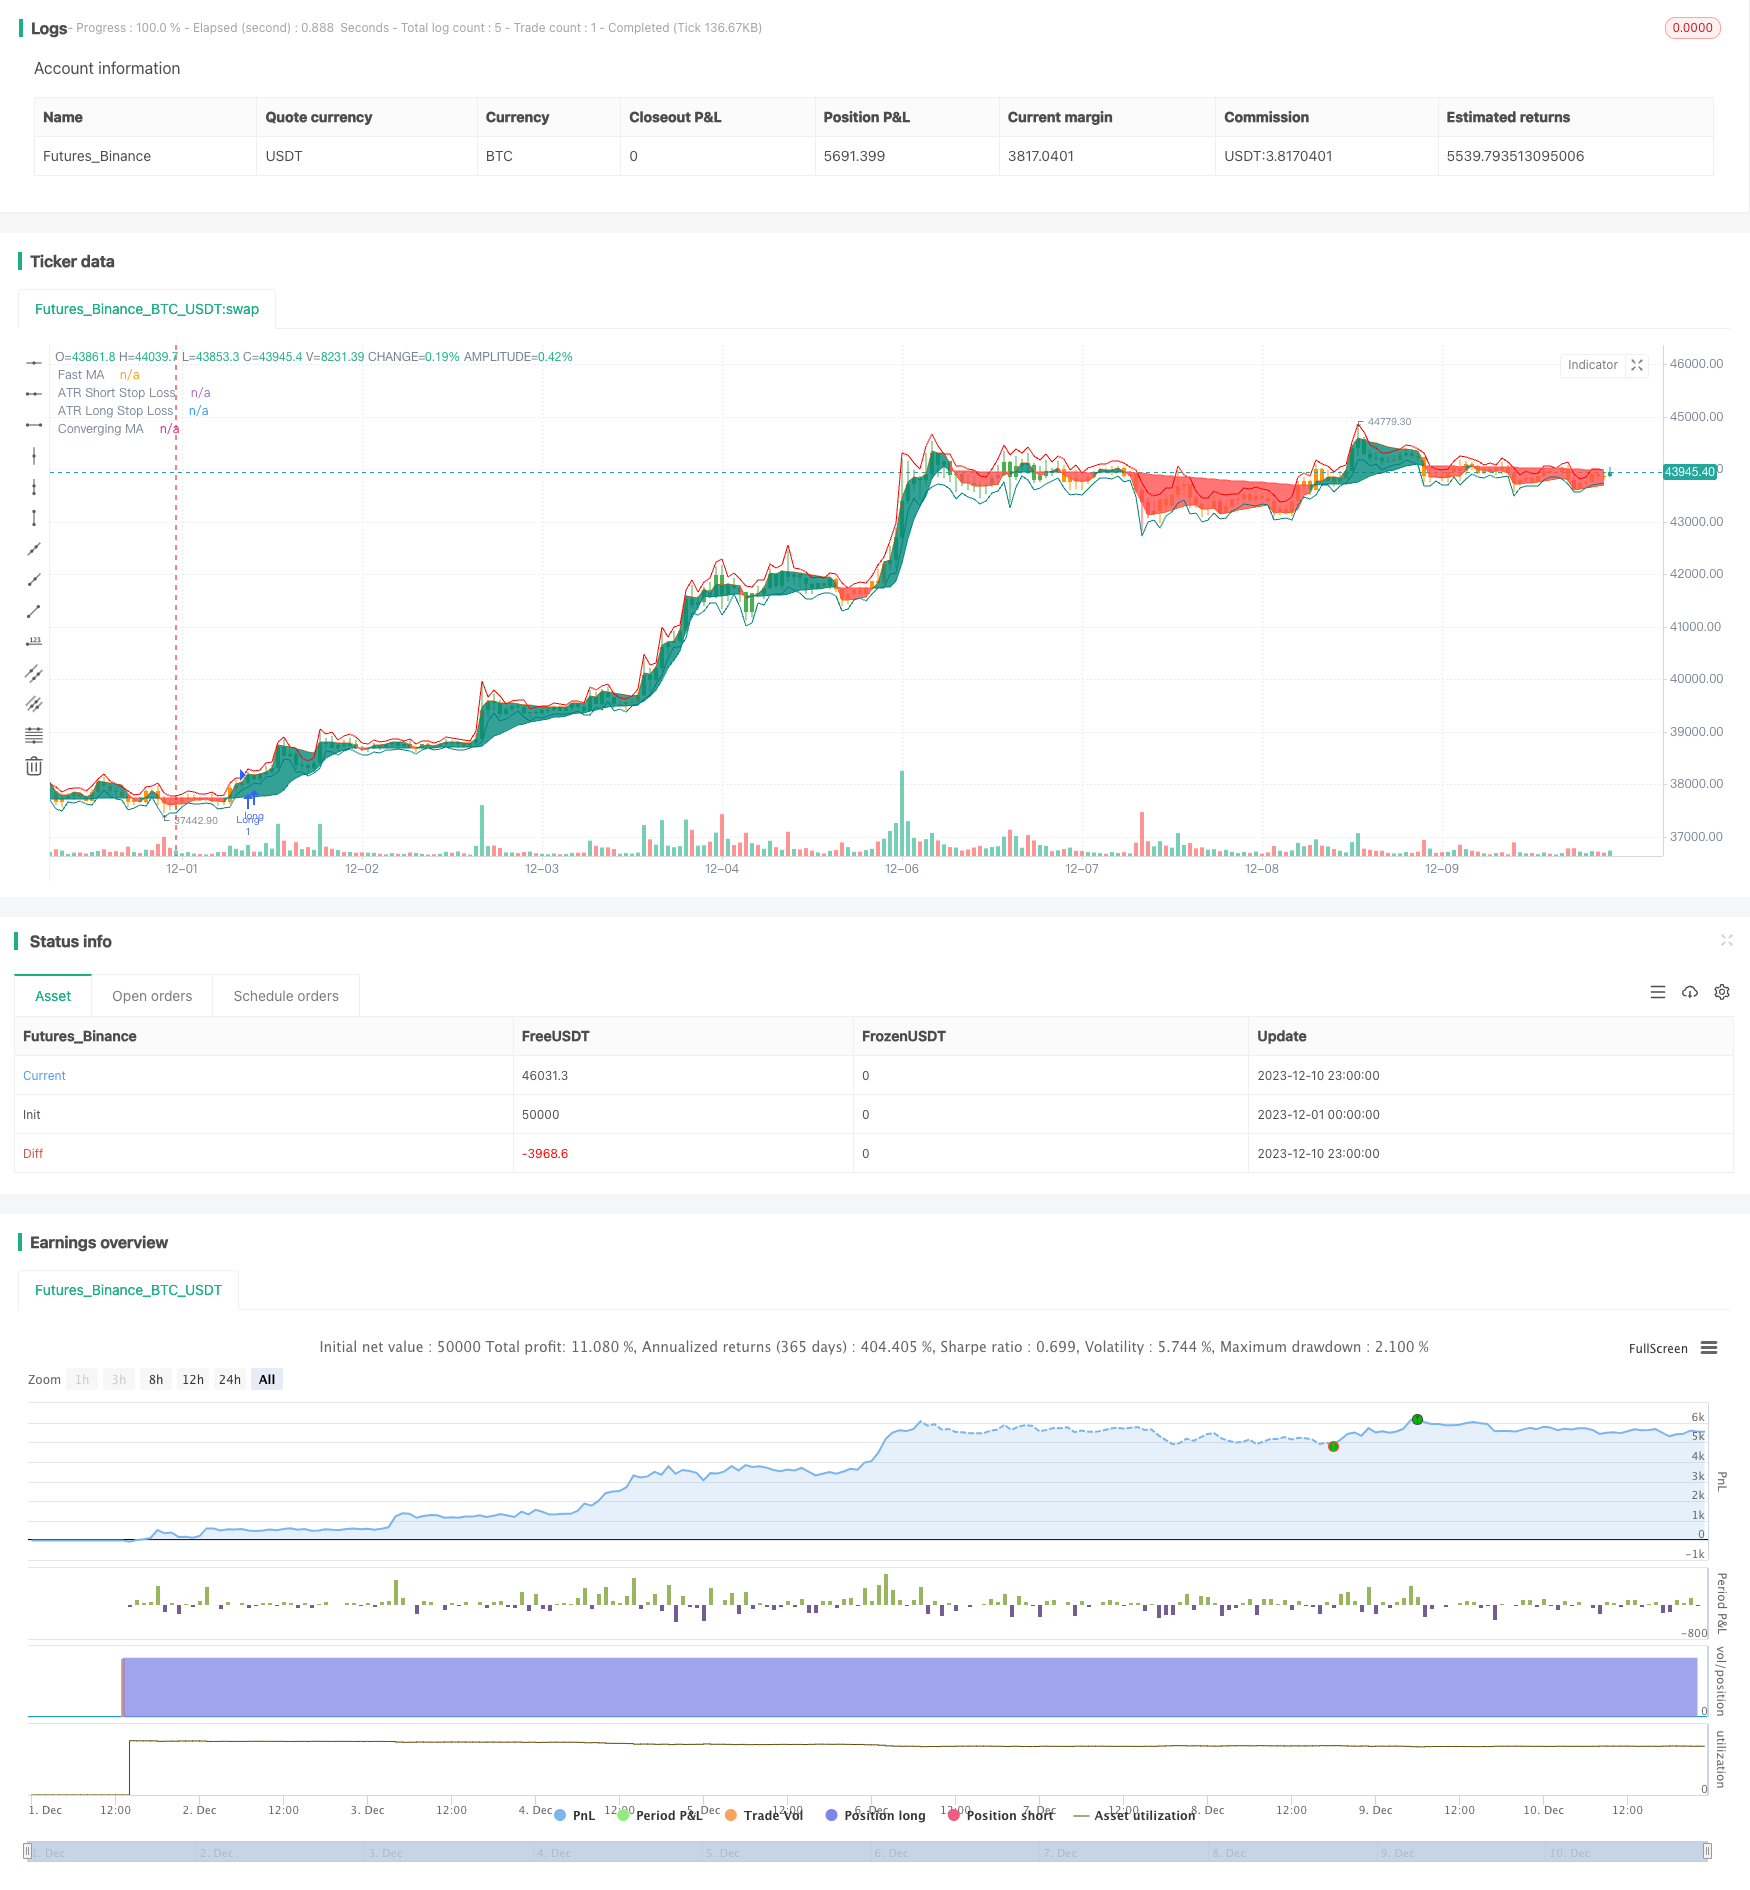
ডাবল এমএ ডায়নামিক ব্রেক-আউট কৌশলটি একটি পরিমাণগত ট্রেডিং কৌশল যা ডাবল মুভিং এভারেজ এবং আরএসআই সূচকগুলির সমন্বয় করে। এই কৌশলটি দ্রুত চলমান গড়, ধীর চলমান গড় এবং আরএসআই সূচকগুলি গণনা করে, বাজারের প্রবণতাপূর্ণ আচরণকে ক্যাপচার করার জন্য ডাবল এমএ স্বর্ণকে ক্রস করার সময় ওভার-বিক্রয় ওভার-বিক্রয় থ্রেশহোল্ড সেট করে।
কৌশল নীতি
ডাবল এমএ মুভিং ব্রেকিং কৌশলটি মূলত ডাবল মুভিং এভারেজ এবং আরএসআই সূচকগুলির উপর ভিত্তি করে। প্রথমে দুটি মুভিং এভারেজ দ্রুত এবং ধীরে ধীরে গণনা করা হয়, দ্রুত লাইনটি 10 দিনের ওজনের মুভিং এভারেজ এবং ধীর লাইনটি 100 দিনের লিনিয়ার অ্যাডজাস্টমেন্টাল মুভিং এভারেজ। তারপরে 14 দিনের আরএসআই সূচক গণনা করা হয় এবং একটি ওভারব্লড ওভারসোল থ্রেশহোল্ড সেট করা হয়। যখন দ্রুত লাইনটি ধীর লাইনটি অতিক্রম করে তখন এটি একটি মাল্টিহেড ট্রেড হিসাবে বিচার করা হয় এবং যখন দ্রুত লাইনটি ধীর লাইনটি অতিক্রম করে তখন এটি একটি ফাঁকা ট্রেড হিসাবে বিচার করা হয়।
বিশেষত, যখন সিদ্ধান্ত নেওয়া হয় যে এটি একটি ওভারহেড ট্রেড, তখন যদি এই সময়ের আরএসআই সূচকটি ওভার-বই লাইনের উপরে থাকে তবে একটি ওভারহেড পজিশন খোলা হয়। যখন সিদ্ধান্ত নেওয়া হয় যে এটি একটি খালি হেড ট্রেড, তখন যদি আরএসআই সূচকটি ওভার-বিক্রয় লাইনের নীচে থাকে তবে খালি হেড পজিশন খোলা হয়। পজিশন খোলার পরে, ট্রেডিং সিগন্যালটি বিপরীত হওয়ার সময় একটি বিপরীত পজিশন খোলা হয়।
কৌশলগত সুবিধা
ডাবল এমএ ডায়নামিক ব্রেকিং কৌশলটি ডাবল এমএ এবং আরএসআই সূচকগুলির সাথে মিলিত হয় যা কার্যকরভাবে বাজার প্রবণতা সনাক্ত করতে পারে এবং আরএসআই সূচকগুলিকে ভুয়া ব্রেকিংগুলি ফিল্টার করার জন্য ব্যবহার করতে পারে, যার ফলে ট্রেডিং সিগন্যালের নির্ভরযোগ্যতা বৃদ্ধি পায়। একক এমএ সিস্টেমের তুলনায় এই কৌশলটি অবৈধ ব্যবসায়ের ঘটনাকে উল্লেখযোগ্যভাবে হ্রাস করতে পারে। এছাড়াও, আরএসআই সূচকের প্যারামিটার অপ্টিমাইজেশন কৌশলটির জন্য নমনীয়তা নিয়ে আসে।
কৌশলগত ঝুঁকি
ডাবল এমএ ডায়নামিক পরাজয়ের কৌশলও কিছু ঝুঁকি নিয়ে আসে। ডাবল এমএ সিস্টেমগুলি প্যারামিটারগুলির জন্য সংবেদনশীল এবং বিভিন্ন বাজারের জন্য প্যারামিটারগুলির সংমিশ্রণটি সাবধানতার সাথে পরীক্ষা করা দরকার। এছাড়াও, আরএসআই সূচক দ্বারা নির্ধারিত থ্রেশহোল্ডগুলি যদি অনুপযুক্ত হয় তবে এটি ব্যবসায়ের সুযোগগুলিও হারাতে পারে। অবশেষে, নির্দিষ্ট পরিস্থিতিতে একটি তীব্র চলমান স্টপ লসকে পরাজিত করা যেতে পারে, প্রতিক্রিয়া অনুযায়ী স্টপ লসকে সামঞ্জস্য করা যায়।
কৌশল অপ্টিমাইজেশন
ডাবল এমএ ডায়নামিক ব্রেকআউট কৌশলটি নিম্নলিখিত দিকগুলি থেকে অপ্টিমাইজ করা যেতে পারেঃ
- দ্রুত বা ধীর MA এর পরামিতিগুলিকে অপ্টিমাইজ করুন এবং সর্বোত্তম প্যারামিটার সমন্বয় খুঁজুন;
- আরএসআই প্যারামিটারগুলিকে অপ্টিমাইজ করুন এবং ওভার-বই ওভার-বিক্রয় থ্রেশহোল্ডগুলিকে সামঞ্জস্য করুন;
- ঝুঁকি নিয়ন্ত্রণের জন্য স্বনির্ধারিত গতিশীল ক্ষতির ব্যবস্থা বৃদ্ধি করা;
- এই মডিউলটি খোলার পরিমাণের অপ্টিমাইজেশান এবং তহবিলের ব্যবহারের দক্ষতা বাড়ানোর জন্য।
সারসংক্ষেপ
ডাবল এমএ ডায়নামিক ব্রেকআউট কৌশলটি ডাবল এমএ সিস্টেমের মাধ্যমে প্রবণতার দিক নির্ধারণ করে এবং আরএসআই সূচক ফিল্টারিং সংকেত ব্যবহার করে একক এমএ সিস্টেমের ত্রুটিগুলি কার্যকরভাবে উন্নত করতে পারে। এই কৌশলটির প্যারামিটারগুলি অনুকূলিতকরণের জন্য প্রচুর জায়গা রয়েছে এবং এটি একটি দুর্দান্ত প্রবণতা ট্র্যাকিং কৌশল।
/*backtest
start: 2023-12-01 00:00:00
end: 2023-12-10 23:59:59
period: 1h
basePeriod: 15m
exchanges: [{"eid":"Futures_Binance","currency":"BTC_USDT"}]
*/

// This work is licensed under a Attribution-NonCommercial-ShareAlike 4.0 International (CC BY-NC-SA 4.0) https://creativecommons.org/licenses/by-nc-sa/4.0/
// © Salman4sgd

//@version=5
strategy("MAConverging + QQE Threshold Strategy", overlay = true)
//------------------------------------------------------------------------------
//Settings
//-----------------------------------------------------------------------------{
length = input(100)

incr   = input(10, "Increment")

fast   = input(10)

src    = input(close)

//-----------------------------------------------------------------------------}
//Calculations
//-----------------------------------------------------------------------------{
var ma    = 0.
var fma   = 0.
var alpha = 0.
var k     = 1 / incr

upper = ta.highest(length)
lower = ta.lowest(length)
init_ma = ta.sma(src, length)

cross = ta.cross(src,ma)

alpha := cross ? 2 / (length + 1)
  : src > ma and upper > upper[1] ? alpha + k
  : src < ma and lower < lower[1] ? alpha + k
  : alpha

ma := nz(ma[1] + alpha[1] * (src - ma[1]), init_ma)

fma := nz(cross ? math.avg(src, fma[1])
  : src > ma ? math.max(src, fma[1]) + (src - fma[1]) / fast
  : math.min(src, fma[1]) + (src - fma[1]) / fast,src)

//-----------------------------------------------------------------------------}
//Plots
//-----------------------------------------------------------------------------{
css = fma > ma ? color.teal : color.red

plot0 = plot(fma, "Fast MA"
  , color = #ff5d00
  , transp = 100)

plot1 = plot(ma, "Converging MA"
  , color = css)

fill(plot0, plot1, css
  , "Fill"
  , transp = 80)

//-----------------------------------------------------------------------------}

RSI_Period = input(14, title='RSI Length')
SF = input(5, title='RSI Smoothing')
QQE = input(4.238, title='Fast QQE Factor')
ThreshHold = input(10, title='Thresh-hold')
//
sQQEx = input(false, title='Show Smooth RSI, QQE Signal crosses')
sQQEz = input(false, title='Show Smooth RSI Zero crosses')
sQQEc = input(false, title='Show Smooth RSI Thresh Hold Channel Exits')
ma_type = input.string(title='MA Type', defval='EMA', options=['ALMA', 'EMA', 'DEMA', 'TEMA', 'WMA', 'VWMA', 'SMA', 'SMMA', 'HMA', 'LSMA', 'PEMA'])
lsma_offset = input.int(defval=0, title='* Least Squares (LSMA) Only - Offset Value', minval=0)
alma_offset = input.float(defval=0.85, title='* Arnaud Legoux (ALMA) Only - Offset Value', minval=0, step=0.01)
alma_sigma = input.int(defval=6, title='* Arnaud Legoux (ALMA) Only - Sigma Value', minval=0)
inpDrawBars = input(true, title='color bars?')


ma(type, src, len) =>
    float result = 0
    if type == 'SMA'  // Simple
        result := ta.sma(src, len)
        result
    if type == 'EMA'  // Exponential
        result := ta.ema(src, len)
        result
    if type == 'DEMA'  // Double Exponential
        e = ta.ema(src, len)
        result := 2 * e - ta.ema(e, len)
        result
    if type == 'TEMA'  // Triple Exponential
        e = ta.ema(src, len)
        result := 3 * (e - ta.ema(e, len)) + ta.ema(ta.ema(e, len), len)
        result
    if type == 'WMA'  // Weighted
        result := ta.wma(src, len)
        result
    if type == 'VWMA'  // Volume Weighted
        result := ta.vwma(src, len)
        result
    if type == 'SMMA'  // Smoothed
        w = ta.wma(src, len)
        result := na(w[1]) ? ta.sma(src, len) : (w[1] * (len - 1) + src) / len
        result
    if type == 'HMA'  // Hull
        result := ta.wma(2 * ta.wma(src, len / 2) - ta.wma(src, len), math.round(math.sqrt(len)))
        result
    if type == 'LSMA'  // Least Squares
        result := ta.linreg(src, len, lsma_offset)
        result
    if type == 'ALMA'  // Arnaud Legoux
        result := ta.alma(src, len, alma_offset, alma_sigma)
        result
    if type == 'PEMA'
        // Copyright (c) 2010-present, Bruno Pio
        // Copyright (c) 2019-present, Alex Orekhov (everget)
        // Pentuple Exponential Moving Average script may be freely distributed under the MIT license.
        ema1 = ta.ema(src, len)
        ema2 = ta.ema(ema1, len)
        ema3 = ta.ema(ema2, len)
        ema4 = ta.ema(ema3, len)
        ema5 = ta.ema(ema4, len)
        ema6 = ta.ema(ema5, len)
        ema7 = ta.ema(ema6, len)
        ema8 = ta.ema(ema7, len)
        pema = 8 * ema1 - 28 * ema2 + 56 * ema3 - 70 * ema4 + 56 * ema5 - 28 * ema6 + 8 * ema7 - ema8
        result := pema
        result
    result

src := input(close, title='RSI Source')
//

//
Wilders_Period = RSI_Period * 2 - 1


Rsi = ta.rsi(src, RSI_Period)
RsiMa = ma(ma_type, Rsi, SF)
AtrRsi = math.abs(RsiMa[1] - RsiMa)
MaAtrRsi = ma(ma_type, AtrRsi, Wilders_Period)
dar = ma(ma_type, MaAtrRsi, Wilders_Period) * QQE

longband = 0.0
shortband = 0.0
trend = 0

DeltaFastAtrRsi = dar
RSIndex = RsiMa
newshortband = RSIndex + DeltaFastAtrRsi
newlongband = RSIndex - DeltaFastAtrRsi
longband := RSIndex[1] > longband[1] and RSIndex > longband[1] ? math.max(longband[1], newlongband) : newlongband
shortband := RSIndex[1] < shortband[1] and RSIndex < shortband[1] ? math.min(shortband[1], newshortband) : newshortband
cross_1 = ta.cross(longband[1], RSIndex)
trend := ta.cross(RSIndex, shortband[1]) ? 1 : cross_1 ? -1 : nz(trend[1], 1)
FastAtrRsiTL = trend == 1 ? longband : shortband

//
// Find all the QQE Crosses
QQExlong = 0
QQExlong := nz(QQExlong[1])
QQExshort = 0
QQExshort := nz(QQExshort[1])
QQExlong := sQQEx and FastAtrRsiTL < RSIndex ? QQExlong + 1 : 0
QQExshort := sQQEx and FastAtrRsiTL > RSIndex ? QQExshort + 1 : 0
// Zero cross
QQEzlong = 0
QQEzlong := nz(QQEzlong[1])
QQEzshort = 0
QQEzshort := nz(QQEzshort[1])
QQEzlong := sQQEz and RSIndex >= 50 ? QQEzlong + 1 : 0
QQEzshort := sQQEz and RSIndex < 50 ? QQEzshort + 1 : 0
//
// Thresh Hold channel Crosses give the BUY/SELL alerts.
QQEclong = 0
QQEclong := nz(QQEclong[1])
QQEcshort = 0
QQEcshort := nz(QQEcshort[1])
QQEclong := sQQEc and RSIndex > 50 + ThreshHold ? QQEclong + 1 : 0
QQEcshort := sQQEc and RSIndex < 50 - ThreshHold ? QQEcshort + 1 : 0


// // QQE exit from Thresh Hold Channel
// plotshape(sQQEc and QQEclong == 1 ? RsiMa - 50 : na, title='QQE XC Over Channel', style=shape.diamond, location=location.absolute, color=color.new(color.olive, 0), size=size.small, offset=0)
// plotshape(sQQEc and QQEcshort == 1 ? RsiMa - 50 : na, title='QQE XC Under Channel', style=shape.diamond, location=location.absolute, color=color.new(color.red, 0), size=size.small, offset=0)
// // QQE crosses
// plotshape(sQQEx and QQExlong == 1 ? FastAtrRsiTL[1] - 50 : na, title='QQE XQ Cross Over', style=shape.circle, location=location.absolute, color=color.new(color.lime, 0), size=size.small, offset=-1)
// plotshape(sQQEx and QQExshort == 1 ? FastAtrRsiTL[1] - 50 : na, title='QQE XQ Cross Under', style=shape.circle, location=location.absolute, color=color.new(color.blue, 0), size=size.small, offset=-1)
// // Signal crosses zero line
// plotshape(sQQEz and QQEzlong == 1 ? RsiMa - 50 : na, title='QQE XZ Zero Cross Over', style=shape.square, location=location.absolute, color=color.new(color.aqua, 0), size=size.small, offset=0)
// plotshape(sQQEz and QQEzshort == 1 ? RsiMa - 50 : na, title='QQE XZ Zero Cross Under', style=shape.square, location=location.absolute, color=color.new(color.fuchsia, 0), size=size.small, offset=0)

// hcolor = RsiMa - 50 > ThreshHold ? color.green : RsiMa - 50 < 0 - ThreshHold ? color.red : color.orange
// plot(FastAtrRsiTL - 50, color=color.new(color.blue, 0), linewidth=2)
// p1 = plot(RsiMa - 50, color=color.new(color.orange, 0), linewidth=2)
// plot(RsiMa - 50, color=hcolor, style=plot.style_columns, transp=50)


// hZero = hline(0, color=color.black, linestyle=hline.style_dashed, linewidth=1)
// hUpper = hline(ThreshHold, color=color.green, linestyle=hline.style_dashed, linewidth=2)
// hLower = hline(0 - ThreshHold, color=color.red, linestyle=hline.style_dashed, linewidth=2)
// fill(hUpper, hLower, color=color.new(color.gray, 80))
//EOF

length := input.int(title='ATR Length', defval=14, minval=1)
smoothing = input.string(title='ATR Smoothing', defval='RMA', options=['RMA', 'SMA', 'EMA', 'WMA'])
m = input(0.3, 'ATR Multiplier')
src1 = input(high)
src2 = input(low)
pline = input(true, 'Show Price Lines')
col1 = input(color.blue, 'ATR Text Color')
col2 = input.color(color.teal, 'Low Text Color', inline='1')
col3 = input.color(color.red, 'High Text Color', inline='2')

collong = input.color(color.teal, 'Low Line Color', inline='1')
colshort = input.color(color.red, 'High Line Color', inline='2')

ma_function(source, length) =>
    if smoothing == 'RMA'
        ta.rma(source, length)
    else
        if smoothing == 'SMA'
            ta.sma(source, length)
        else
            if smoothing == 'EMA'
                ta.ema(source, length)
            else
                ta.wma(source, length)

a = ma_function(ta.tr(true), length) * m
s_sl = ma_function(ta.tr(true), length) * m + src1
l_sl = src2 - ma_function(ta.tr(true), length) * m

p1 = plot(s_sl, title='ATR Short Stop Loss', color=colshort, trackprice=pline ? true : false, transp=20)
p2 = plot(l_sl, title='ATR Long Stop Loss', color=collong, trackprice=pline ? true : false, transp=20)


bgc = RsiMa - 50 > ThreshHold ? color.green : Rsi - 50 < 0 - ThreshHold ? color.red : color.orange
barcolor(inpDrawBars ? bgc : na)
prebuy = RsiMa - 50 > ThreshHold
buy=prebuy and not(prebuy[1]) and fma > ma

var long_tp=0.0
var long_sl=0.0
var short_tp=0.0
var short_sl=0.0

if prebuy
    strategy.close("Short")


if buy and strategy.position_size<=0
    strategy.entry("Long", strategy.long)
    long_sl:=l_sl
    long_tp:=close+(close-long_sl)*2


//if strategy.position_size>0
strategy.exit("L_SL","Long",stop=long_sl)
    //strategy.exit("L_SL","Long",stop=long_sl)
// if low<long_sl[1]
//     strategy.close("Long")

presell=RsiMa - 50 < 0 - ThreshHold // RsiMa - 50 < 0 - ThreshHold
sell= presell and not(presell[1]) and fma < ma

//plotshape(presell)

if presell
    strategy.close("Long")

if sell and strategy.position_size>=0
    strategy.entry("Short", strategy.short)
    short_sl:=s_sl
    short_tp:=close-(short_sl-close)*2

//if strategy.position_size<0
strategy.exit("S_SL","Short",stop=short_sl)
    //strategy.exit("S_SL","Short",stop=short_sl)