সময় ফ্রেম জুড়ে মোমেন্টাম ট্র্যাকিং কৌশল
ওভারভিউ
এই কৌশলটি 123 বিপরীত এবং MACD সূচকগুলির সংমিশ্রণের মাধ্যমে সময়ের ফ্রেম জুড়ে গতিশীলতা অনুসরণ করে। 123 বিপরীত একটি স্বল্পমেয়াদী প্রবণতা বিপরীত বিন্দু নির্ধারণ করে এবং MACD একটি মধ্য-দীর্ঘমেয়াদী প্রবণতা নির্ধারণ করে, উভয়ই সংযুক্ত হয় এবং স্বল্পমেয়াদী বিপরীতের সময় মধ্য-দীর্ঘমেয়াদী প্রবণতা লক করার জন্য একটি পল্টু-বাক সংকেত দেয়।
কৌশল নীতি
এই কৌশল দুটি অংশে বিভক্তঃ
123 বিপরীত অংশঃ বর্তমান দুটি K লাইন উচ্চ / নিম্ন গঠন করে এবং 50 এর নিচে / উপরে যখন এলোমেলো সূচকটি ক্রয় / বিক্রয় সংকেত উত্পন্ন করে।
MACD অংশঃ দ্রুত লাইনে ধীর লাইন অতিক্রম করার সময় কেনার সংকেত তৈরি করে, দ্রুত লাইনের নীচে ধীর লাইন অতিক্রম করার সময় বিক্রয় সংকেত তৈরি করে।
অবশেষে, এই দুটি সংযুক্ত করা হয়, অর্থাৎ 123 বিপরীত হওয়ার সাথে সাথে MACD একটি সমান্তরাল সংকেত উত্পন্ন করে, যা চূড়ান্ত সংকেত দেয়।
সামর্থ্য বিশ্লেষণ
এই কৌশলটি স্বল্পমেয়াদী বিপরীত এবং মধ্য-দীর্ঘমেয়াদী প্রবণতাকে একত্রিত করে, যা স্বল্পমেয়াদী ওঠানামার মধ্যে মধ্য-দীর্ঘমেয়াদী প্রবণতাকে লক করতে পারে, যার ফলে উচ্চতর জয়লাভের হার অর্জন করা যায়। বিশেষত, অস্থিরতার ক্ষেত্রে, 123 বিপরীতের মাধ্যমে কিছু শব্দ মুছে ফেলা যায়, যার ফলে স্থিতিশীলতা বৃদ্ধি পায়।
এছাড়াও, প্যারামিটারগুলি সামঞ্জস্য করে, বিপরীত সিগন্যাল এবং প্রবণতা সংকেতের অনুপাতকে ভারসাম্যযুক্ত করা যায়, যা বিভিন্ন বাজারের পরিবেশের সাথে খাপ খাইয়ে নেয়।
ঝুঁকি বিশ্লেষণ
এই কৌশলটি একটি নির্দিষ্ট সময়ের সাথে পিছিয়ে পড়ে, বিশেষত দীর্ঘ-চক্রের MACD ব্যবহার করার সময়, যা স্বল্পমেয়াদী ঘটনাগুলিকে মিস করতে পারে। উপরন্তু, বিপরীত সিগন্যাল নিজেই একটি নির্দিষ্ট পরিমাণে এলোমেলোতা রয়েছে, যা সহজেই আটকে যায়।
MACD চক্রটি যথাযথভাবে সংক্ষিপ্ত করা যেতে পারে, বা ঝুঁকি নিয়ন্ত্রণের জন্য স্টপ লস বাড়ানো যেতে পারে।
অপ্টিমাইজেশান দিক
এই কৌশলটি নিম্নলিখিত দিকগুলি থেকে উন্নত করা যেতে পারেঃ
123 রিভার্সাল প্যারামিটার সামঞ্জস্য করুন এবং রিভার্সালের জন্য অপ্টিমাইজ করুন
MACD প্যারামিটারগুলিকে সামঞ্জস্য করুন এবং প্রবণতা বিচারকে অপ্টিমাইজ করুন
অন্যান্য সহায়ক সূচক ফিল্টার যুক্ত করুন, কার্যকারিতা বাড়ান
ঝুঁকি নিয়ন্ত্রণের জন্য ক্ষতি বন্ধের কৌশল বাড়ানো
সারসংক্ষেপ
এই কৌশলটি একাধিক প্যারামিটার এবং একাধিক টাইম ফ্রেমের প্রযুক্তিগত সূচকগুলিকে একত্রিত করে, সময় ফ্রেমের গতিশীলতা ট্র্যাকিংয়ের মাধ্যমে বিপরীত ট্রেডিং এবং প্রবণতা ট্রেডিংয়ের সুবিধাগুলিকে ভারসাম্য দেয়। প্যারামিটারগুলির মাধ্যমে ভারসাম্য প্রভাবকে সামঞ্জস্য করতে পারে এবং আরও সূচক বা স্টপ লসকে অপ্টিমাইজ করার জন্য প্রবর্তন করা যেতে পারে, এটি একটি খুব সম্ভাব্য কৌশলগত ধারণা।
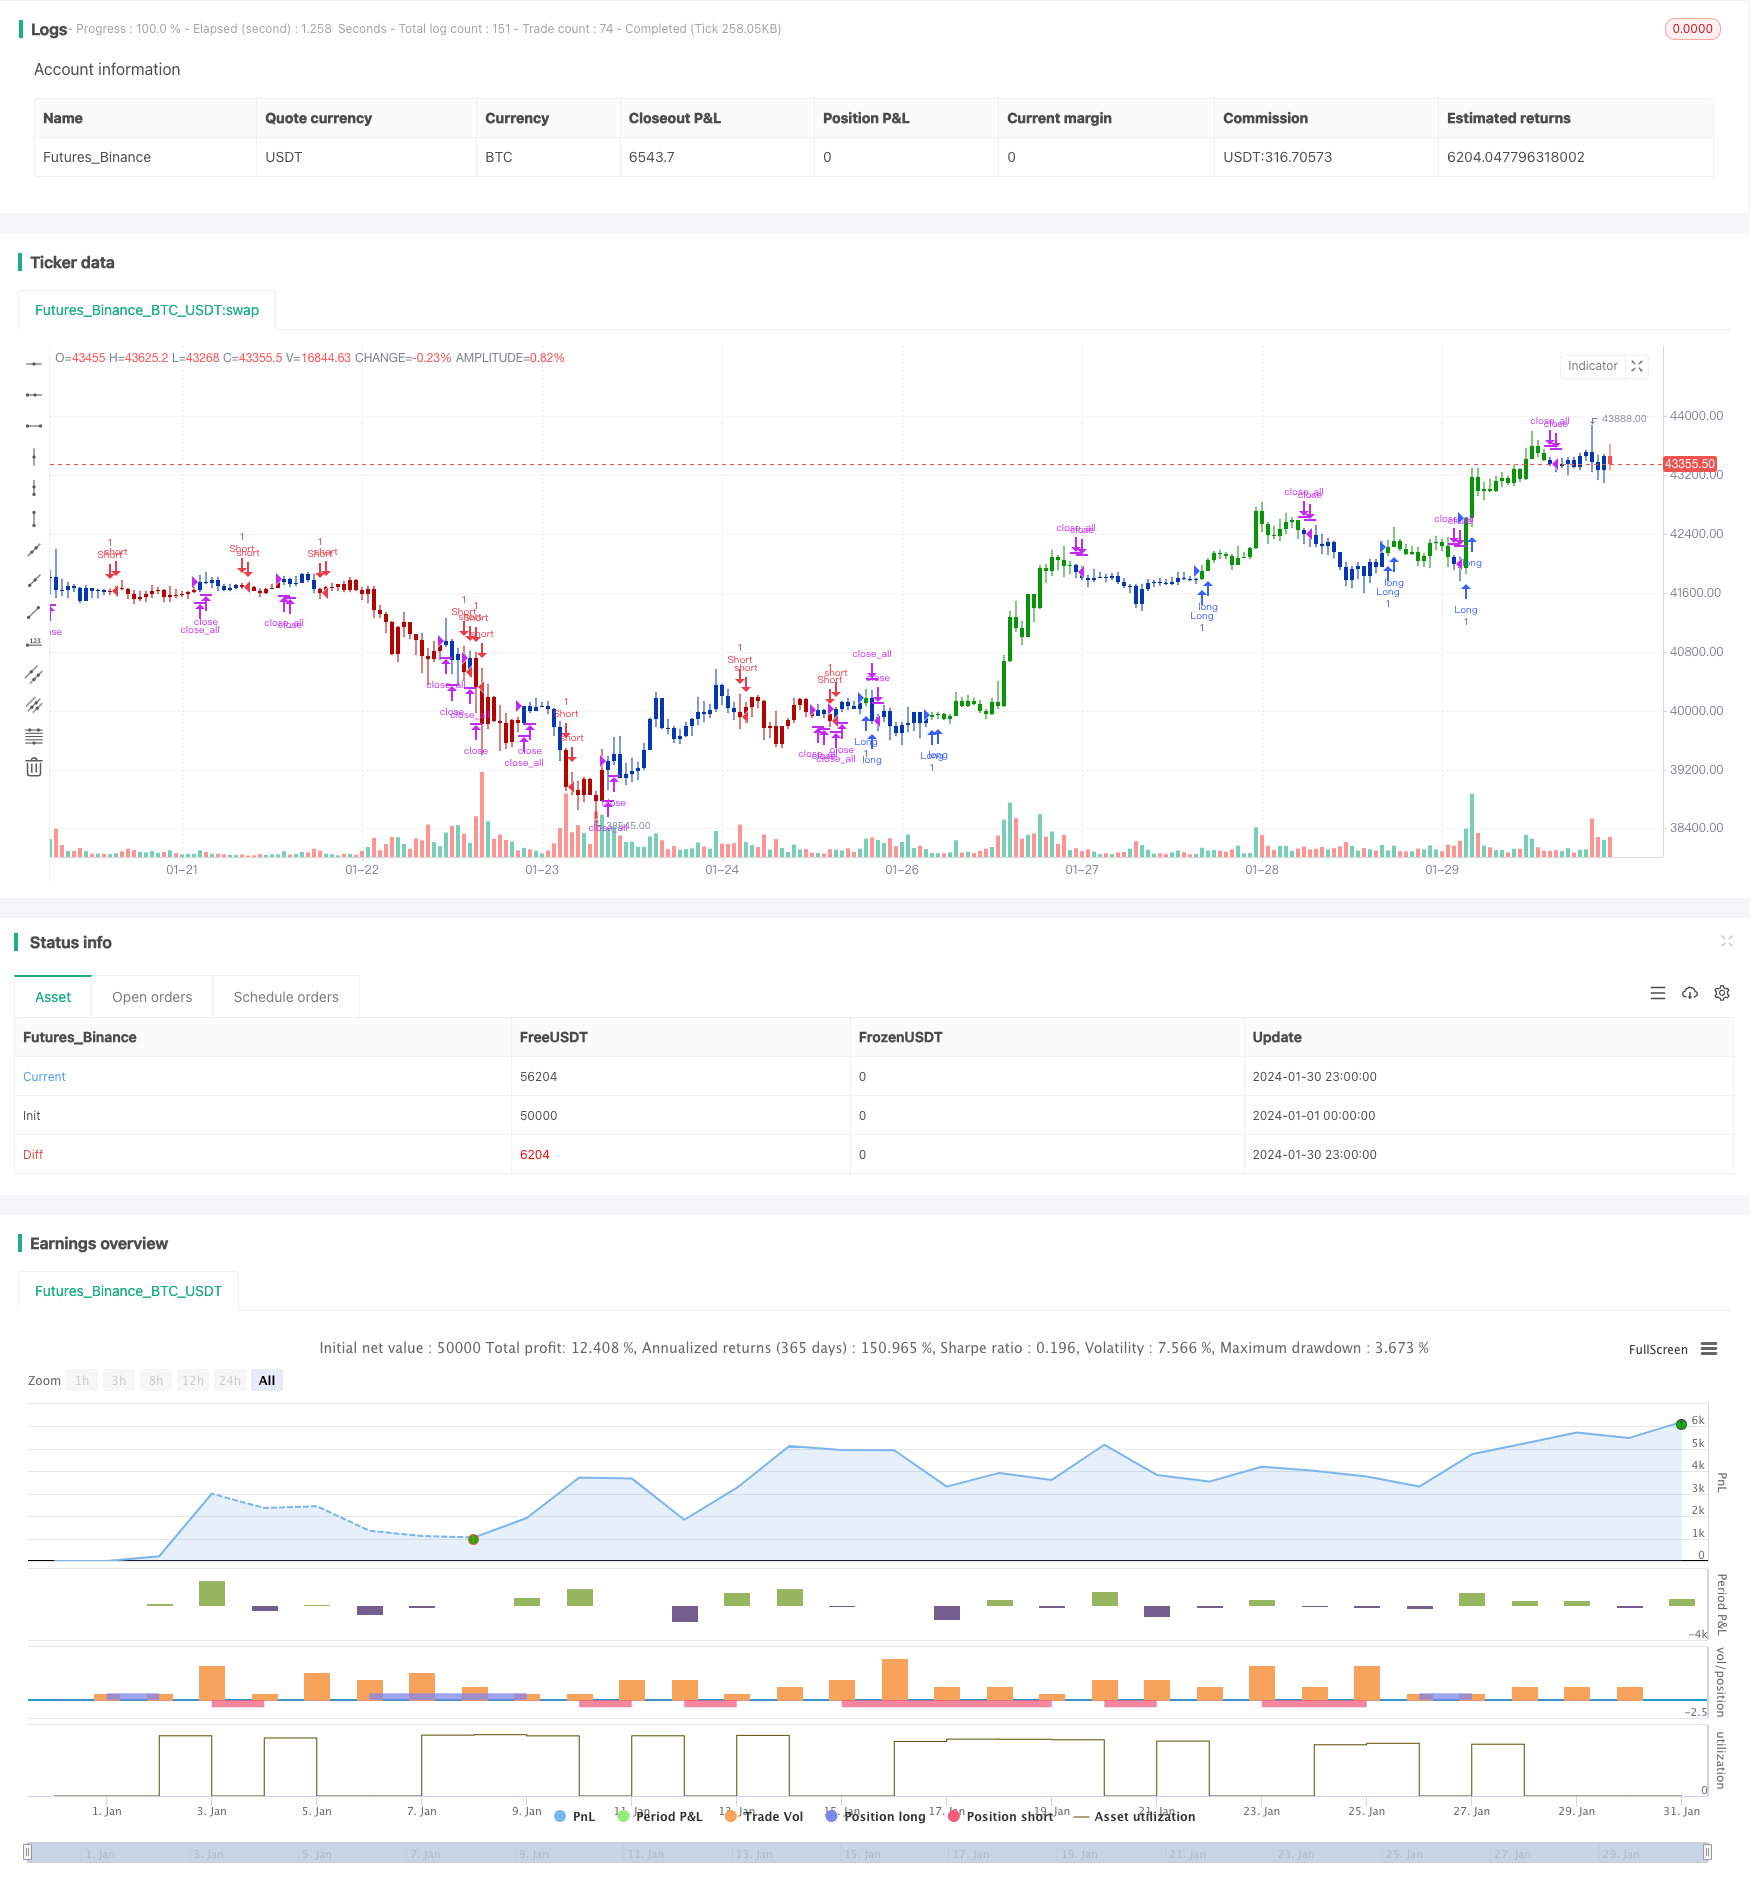
/*backtest
start: 2024-01-01 00:00:00
end: 2024-01-31 00:00:00
period: 1h
basePeriod: 15m
exchanges: [{"eid":"Futures_Binance","currency":"BTC_USDT"}]
*/

//@version=4
////////////////////////////////////////////////////////////
//  Copyright by HPotter v1.0 28/01/2021
// This is combo strategies for get a cumulative signal.
//
// First strategy
// This System was created from the Book "How I Tripled My Money In The
// Futures Market" by Ulf Jensen, Page 183. This is reverse type of strategies.
// The strategy buys at market, if close price is higher than the previous close
// during 2 days and the meaning of 9-days Stochastic Slow Oscillator is lower than 50.
// The strategy sells at market, if close price is lower than the previous close price
// during 2 days and the meaning of 9-days Stochastic Fast Oscillator is higher than 50.
//
// Second strategy
// MACD – Moving Average Convergence Divergence. The MACD is calculated
// by subtracting a 26-day moving average of a security's price from a
// 12-day moving average of its price. The result is an indicator that
// oscillates above and below zero. When the MACD is above zero, it means
// the 12-day moving average is higher than the 26-day moving average.
// This is bullish as it shows that current expectations (i.e., the 12-day
// moving average) are more bullish than previous expectations (i.e., the
// 26-day average). This implies a bullish, or upward, shift in the supply/demand
// lines. When the MACD falls below zero, it means that the 12-day moving average
// is less than the 26-day moving average, implying a bearish shift in the
// supply/demand lines.
// A 9-day moving average of the MACD (not of the security's price) is usually
// plotted on top of the MACD indicator. This line is referred to as the "signal"
// line. The signal line anticipates the convergence of the two moving averages
// (i.e., the movement of the MACD toward the zero line).
// Let's consider the rational behind this technique. The MACD is the difference
// between two moving averages of price. When the shorter-term moving average rises
// above the longer-term moving average (i.e., the MACD rises above zero), it means
// that investor expectations are becoming more bullish (i.e., there has been an
// upward shift in the supply/demand lines). By plotting a 9-day moving average of
// the MACD, we can see the changing of expectations (i.e., the shifting of the
// supply/demand lines) as they occur.
//
// WARNING:
// - For purpose educate only
// - This script to change bars colors.
////////////////////////////////////////////////////////////
Reversal123(Length, KSmoothing, DLength, Level) =>
    vFast = sma(stoch(close, high, low, Length), KSmoothing)
    vSlow = sma(vFast, DLength)
    pos = 0.0
    pos := iff(close[2] < close[1] and close > close[1] and vFast < vSlow and vFast > Level, 1,
	         iff(close[2] > close[1] and close < close[1] and vFast > vSlow and vFast < Level, -1, nz(pos[1], 0)))
	pos

MACD(fastLength,slowLength,signalLength) =>
    pos = 0.0
    fastMA = ema(close, fastLength)
    slowMA = ema(close, slowLength)
    macd = fastMA - slowMA
    signal = sma(macd, signalLength)
    pos:= iff(signal < macd , 1,
	       iff(signal > macd, -1, nz(pos[1], 0)))
    pos

strategy(title="Combo Backtest 123 Reversal & MACD Crossover", shorttitle="Combo", overlay = true)
line1 = input(true, "---- 123 Reversal ----")
Length = input(14, minval=1)
KSmoothing = input(1, minval=1)
DLength = input(3, minval=1)
Level = input(50, minval=1)
//-------------------------
fastLength = input(8, minval=1)
slowLength = input(16,minval=1)
signalLength=input(11,minval=1)
xSeria = input(title="Source", type=input.source, defval=close)
reverse = input(false, title="Trade reverse")
posReversal123 = Reversal123(Length, KSmoothing, DLength, Level)
posMACD = MACD(fastLength,slowLength, signalLength)
pos = iff(posReversal123 == 1 and posMACD == 1 , 1,
	   iff(posReversal123 == -1 and posMACD == -1, -1, 0))
possig = iff(reverse and pos == 1, -1,
          iff(reverse and pos == -1 , 1, pos))
if (possig == 1)
    strategy.entry("Long", strategy.long)
if (possig == -1)
    strategy.entry("Short", strategy.short)
if (possig == 0)
    strategy.close_all()
barcolor(possig == -1 ? #b50404: possig == 1 ? #079605 : #0536b3 )