মোমেন্টাম ভিত্তিক ব্রেকআউট ট্রেডিং কৌশল
ওভারভিউ
এই কৌশলটি একটি গতিশীল সূচক-ভিত্তিক ব্রেকিং ট্রেডিং কৌশল। এটি গড়, এটিআর, আরএসআই ইত্যাদির মতো একাধিক সূচক ব্যবহার করে বাজার প্রবণতা এবং ওঠানামা নির্ধারণ করে, কঠোর স্টপ-ড্রপ সেটআপের সাথে ট্রেড করার জন্য। কৌশলটি মূলত সিদ্ধান্ত নেয় যে দামটি উত্থান বা নীচের গড়ের মধ্য দিয়ে ভেঙে যাবে কিনা এবং এটিআর পরিসীমা যুক্ত করে একটি ট্রেডিং সংকেত তৈরি করবে।
কৌশল নীতি
এই কৌশলটি মূলত নিম্নলিখিত বিষয়গুলির উপর ভিত্তি করে তৈরি করা হয়েছেঃ
ইএমএ গড় লাইন ব্যবহার করে দামের প্রবণতার দিক নির্ণয় করুন। দামের উপরে গড় লাইনটি বিউটিজ সিগন্যাল হিসাবে এবং নীচে বিউটিজ সিগন্যাল হিসাবে পরিধান করুন।
এটিআর সূচকটি বাজারের ওঠানামা নির্ধারণ করে। এটিআরকে স্টপ লস হিসাবে একটি ফ্যাক্টর দ্বারা গুণিত করা হয়। এটি একক ক্ষতিকে কার্যকরভাবে নিয়ন্ত্রণ করতে পারে।
আরএসআই সূচকটি ওভারবই ওভারসোলের বিচার করে। এটিআর স্টপ লস এবং গড় লাইন বিচার করে একটি ব্রেকআউট ট্রেডিং অবশ্যই আরএসআই ওভারবই বা ওভারসোলের ক্ষেত্রে ট্রিগার করতে হবে। এটি মিথ্যা ব্রেকআউট এড়াতে পারে।
পূর্ববর্তী উচ্চ বা নিম্ন পয়েন্টগুলিকে স্টপ-আউট ভিত্তি হিসাবে ব্যবহার করুন। স্টপ-আউট মূল্যগুলি ট্র্যাক করে আরও বেশি লাভের জন্য লক করুন।
কঠোর স্টপ-অফ-লস নিয়ম। এটিআর স্টপ-অফ-লস ও ওভাররাইডিং-এর সংমিশ্রণ ঝুঁকি নিয়ন্ত্রণ করে এবং স্টপ-অফ-সেটিং-এর মাধ্যমে মুনাফা লক করা যায়।
প্রবেশের সিগন্যাল হল মূল্যের ব্রেক মিডল লাইন প্লাস এটিআর স্টপ ডোমেন। যদি এটি একটি bullish সংকেত হয়, তবে দামটি উচ্চ পয়েন্ট অতিক্রম করতে হবে; যদি এটি একটি bearish সংকেত হয়, তবে দামটি নিম্ন পয়েন্ট অতিক্রম করতে হবে।
সামর্থ্য বিশ্লেষণ
এই কৌশলটির সুবিধাগুলো হলঃ
মাল্টি-ইনডিকেটর বিচার মিথ্যা ভাঙ্গন এড়াতে এবং সংকেত নির্ভুলতা উন্নত করতে পারে
এটিআর স্টপ লস রেঞ্জ সেটিং যা ক্ষয়ক্ষতি নিয়ন্ত্রণ করে
ডায়নামিক ট্র্যাকিং স্টপগুলি সর্বাধিক মুনাফা অর্জন করে
কঠোর স্টপ-অফ-লস নিয়ম ঝুঁকি নিয়ন্ত্রণে সহায়তা করে
সূচক এবং প্যারামিটার অপ্টিমাইজ করার জন্য অনেক জায়গা রয়েছে, যা বিভিন্ন বাজারের সাথে সামঞ্জস্যপূর্ণ
ঝুঁকি বিশ্লেষণ
এই কৌশলটি নিম্নলিখিত ঝুঁকিগুলিও বহন করেঃ
মুনাফা অর্জনের ক্ষমতা বাজার ওঠানামার সাথে সম্পর্কিত। যখন বাজার প্রবণতা অস্পষ্ট বা দীর্ঘ চক্র থাকে, তখন মুনাফা অর্জনের স্থান সীমিত থাকে।
স্টপ প্রাইসের ঝড়ের পরে আবারও একটি ব্রেকআউট হতে পারে। এই ক্ষেত্রে, সময়মতো পজিশন ট্র্যাকিংয়ের অক্ষমতার কারণ হতে পারে। স্টপ প্রাইসটি যথাযথভাবে শিথিল করা যেতে পারে।
chasing。
অপ্টিমাইজেশান দিক
এই কৌশলটি নিম্নলিখিত দিকগুলি থেকে উন্নত করা যেতে পারেঃ
গড় রেখা প্যারামিটার, এটিআর প্যারামিটার ইত্যাদি বিভিন্ন জাত এবং সময়কালের সাথে সামঞ্জস্য করে।
আপনি আরও সূচক বিচার করতে পারেন, যেমন MACD, KDJ ইত্যাদি।
এটিআর মান অনুযায়ী রিয়েল টাইমে স্টপ লস ফ্যাক্টর সামঞ্জস্য করা যায়। এটি স্টপ লসকে বাজার ওঠানামা প্রতি আরও অনুকূল করে তোলে।
একাধিক সময়কালের সমন্বয় তৈরি করুন। বিভিন্ন সময়কালের সূচকগুলির সমন্বয় সংকেতের গুণমানকে উন্নত করতে পারে।
মেশিন লার্নিং প্রযুক্তি ব্যবহার করা হয় নির্দেশক এবং প্যারামিটারগুলি পরীক্ষা এবং অপ্টিমাইজ করার জন্য, যাতে কৌশল প্যারামিটারগুলি সর্বোত্তম হয়।
সারসংক্ষেপ
এই কৌশলটি সামগ্রিকভাবে একটি সূচক ব্যবহার করে বিচার করা হয়, কঠোরভাবে স্টপ লস স্টপিংয়ের একটি ব্রেকিং ট্রেডিং কৌশল। এটি গড় লাইন, এটিআর এবং আরএসআই এর মতো সূচকগুলির সুবিধাগুলি কার্যকরভাবে ব্যবহার করে, যা বাজারের প্রবণতার দিকটি কার্যকরভাবে নির্ধারণ করতে পারে। কঠোর স্টপ লস স্টপ সেটিংয়ের সাথে মিলিত হয়ে ট্রেন্ড লাভের ঝুঁকি নিয়ন্ত্রণ করতে পারে। প্যারামিটার এবং নিয়মের মাধ্যমে অপ্টিমাইজ করা, এই কৌশলটি দীর্ঘমেয়াদী ব্যবহারের জন্য একটি পরিমাণগত ট্রেডিং কৌশল হতে পারে।
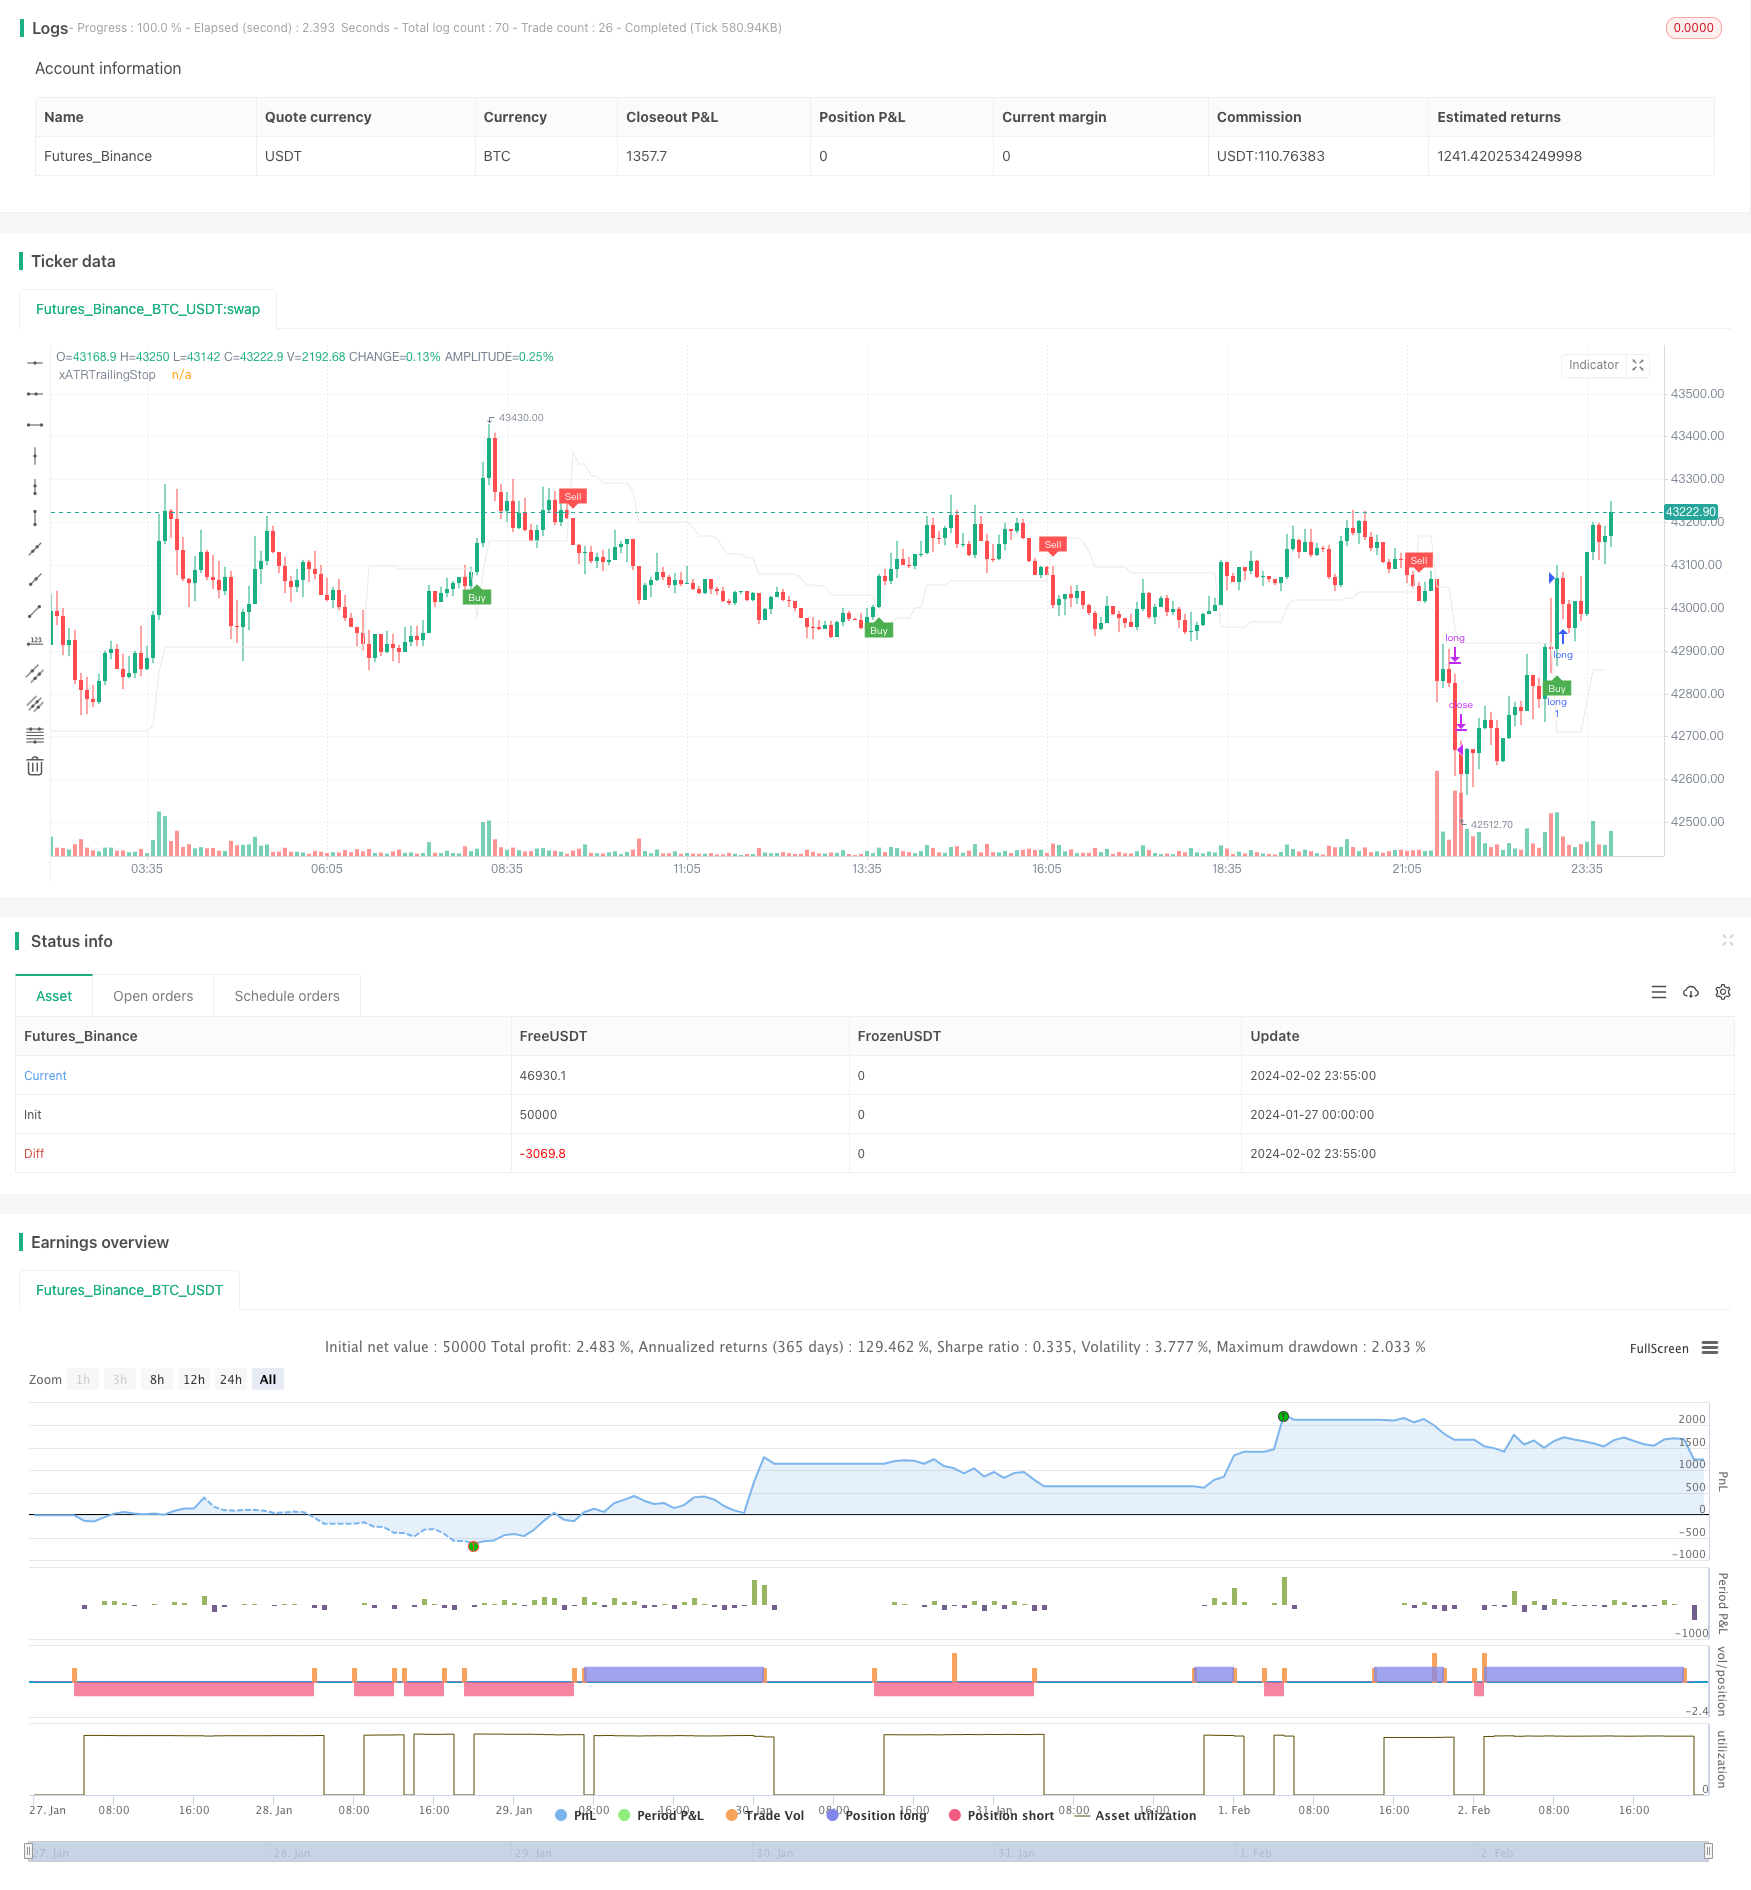
/*backtest
start: 2024-01-27 00:00:00
end: 2024-02-03 00:00:00
period: 5m
basePeriod: 1m
exchanges: [{"eid":"Futures_Binance","currency":"BTC_USDT"}]
*/

//@version=4
strategy(title="UT Bot Strategy", overlay = true)
//CREDITS to HPotter for the orginal code. The guy trying to sell this as his own is a scammer lol.
// Inputs
emaLengh = input(2, title = "emaLengh")
a = input(3.0,     title = "Key Vaule. 'This changes the sensitivity'")
c = input(10,    title = "ATR Period")
h = input(false, title = "Signals from Heikin Ashi Candles")
emaLengh2 = input(9, title = "emaLengh show")


rate = input(0.00025,    title = "波动率min")
rateMax = input(0.00045,    title = "波动率max")
adx_length =   input(20,    title = "adx_length")
adx_min =   input(14,    title = "adx_min")

sma_length =   input(11,    title = "sma_length")
rsi_len = input(9, title = "rsi_len")

src = h ? security(heikinashi(syminfo.tickerid), timeframe.period, close, lookahead = false) : close

// boll 通道----------------------------------------------------
length = input(20, minval=1)
mult = input(2.0, minval=0.001, maxval=50, title="StdDev")
basis = sma(src, length)
dev = mult * stdev(src, length)
upper = basis + dev
lower = basis - dev
bbr = (src - lower)/(upper - lower)
// plot(upper, color = color.rgb(46, 59, 240), title="upper")
// plot(lower, color = color.rgb(46, 59, 240), title="lower")


// plot(bbr, "Bollinger Bands %B", color=#26A69A)
// band1 = hline(1, "Overbought", color=#787B86, linestyle=hline.style_dashed)
// hline(0.5, "Middle Band", color=color.new(#787B86, 50))
// band0 = hline(0, "Oversold", color=#787B86, linestyle=hline.style_dashed)
// fill(band1, band0, color=color.rgb(38, 166, 154, 90), title="Background")
// boll 通道----------------------------------------------------

// 线性回归 --------------------------------------------------------------
zlsma_length = input(title="zlsma-Length", type=input.integer, defval=50)
zlsma_offset = input(title="zlsma-Offset", type=input.integer, defval=0)
lsma = linreg(src, zlsma_length, zlsma_offset)
lsma2 = linreg(lsma, zlsma_length, zlsma_offset)
eq= lsma-lsma2
zlsma = lsma+eq
// plot(zlsma , color = color.rgb(243, 243, 14), title="zlsma",linewidth=3)
// 线性回归 --------------------------------------------------------------


// --------------------------------
rsi = rsi(src, 6)

// xHH = sma(high, sma_length)
// xLL = sma(low, sma_length)
// movevalue = (xHH - xLL) / 2
// xHHM = xHH + movevalue
// xLLM = xLL - movevalue

// plot(xHHM, color = color.rgb(208, 120, 219), title="xHHM")
// plot(xLLM, color = color.rgb(208, 120, 219), title="xLLM")


xATR  = atr(c)
nLoss = a * xATR


xATRTrailingStop = 0.0
xATRTrailingStop := iff(src > nz(xATRTrailingStop[1], 0) and src[1] > nz(xATRTrailingStop[1], 0), max(nz(xATRTrailingStop[1]), src - nLoss),
   iff(src < nz(xATRTrailingStop[1], 0) and src[1] < nz(xATRTrailingStop[1], 0), min(nz(xATRTrailingStop[1]), src + nLoss),
   iff(src > nz(xATRTrailingStop[1], 0), src - nLoss, src + nLoss)))


pos = 0
pos :=	iff(src[1] < nz(xATRTrailingStop[1], 0) and src > nz(xATRTrailingStop[1], 0), 1,
   iff(src[1] > nz(xATRTrailingStop[1], 0) and src < nz(xATRTrailingStop[1], 0), -1, nz(pos[1], 0)))

xcolor = pos == -1 ? color.red: pos == 1 ? color.green : color.blue

ema   = ema(src,emaLengh)
// sma   = sma(src,emaLengh)
emaFast   = ema(src,100)
emaSlow   = ema(src,576)
emaShow   = ema(src, emaLengh2)
// sma       =  sma(src, 8)

// [superTrend, dir] = supertrend(3, 200)
// 判断连续涨

[diplus, diminus, adx] = dmi(adx_length, adx_length)


above = crossover(ema, xATRTrailingStop)
below = crossover(xATRTrailingStop, ema)
// above = ema == xATRTrailingStop
// below = xATRTrailingStop== ema

// smaabove = crossover(src, sma)
// smabelow = crossover(sma, src)
// smaabove = src > sma
// smabelow = sma > src
close_rate (n)=>
    abs(close[n]-open[n])/min(close[n],open[n])

rate_val = close_rate(0)
rate_val1 = close_rate(1)

buy  = src > xATRTrailingStop and above  and src > zlsma  and adx >adx_min
// and  src>emaShow
// and rate_val < rate_val1*2 and rate_val >=rate_val1
// and rate_val1<rateMax
// and close[1]>open[1]
sell = src < xATRTrailingStop and below  and src < zlsma and adx >adx_min
// and  src<emaShow
// and rate_val < rate_val1*2  and rate_val >=rate_val1
//  and rate_val1<rateMax
// and open[1]>close[1]  and rate_val1 > rate

// buy  = src > xATRTrailingStop
// sell = src < xATRTrailingStop
// plot(rate_val1 , color = color.red, title="rate_val1")


barbuy  = src > xATRTrailingStop
barsell = src < xATRTrailingStop

atrRsi = rsi(xATRTrailingStop,rsi_len)

// plot(emaFast , color = color.rgb(243, 206, 127), title="emaFast")
// plot(ema , color = color.rgb(47, 227, 27), title="ut-ema")


// plot(emaShow , color = color.rgb(47, 227, 27), title="ema9")

plot(xATRTrailingStop, color = color.rgb(233, 233, 232), title="xATRTrailingStop")

plotshape(buy,  title = "Buy",  text = 'Buy',  style = shape.labelup,   location = location.belowbar, color= color.green, textcolor = color.white, size = size.tiny)
plotshape(sell, title = "Sell", text = 'Sell', style = shape.labeldown, location = location.abovebar, color= color.red,   textcolor = color.white, size = size.tiny)


// plotshape(buy,  title = "Sell",  text = 'Sell',  style = shape.labelup,   location = location.belowbar, color= color.green, textcolor = color.white, transp = 0, size = size.tiny)
// plotshape(sell, title = "buy", text = 'buy', style = shape.labeldown, location = location.abovebar, color= color.red,   textcolor = color.white, transp = 0, size = size.tiny)

// barcolor(barbuy  ? color.green : na)
// barcolor(barsell ? color.red   : na)

// strategy.entry("short",   false, when = buy)
// strategy.entry("long ", true, when = sell)


strategy.entry("long",   true, when = buy and strategy.position_size == 0)
strategy.entry("short", false, when = sell and strategy.position_size == 0)


//动态止盈start------------------------------------------------------------------------------------------
profit = input( 0.015,     title = "最小收益率")
close_profit_rate = input( 10,     title = "平仓收益回撤比")
loss = input(0.004,    title = "回撤率")

// 收益回撤比例
profit_price_scale =profit/close_profit_rate

var float profit_price = 0


// 计算小收益价格

get_profit_price(long) =>
    float res = 0
    if long == true
        res := strategy.position_avg_price * (1+profit)
    if long == false
        res := strategy.position_avg_price * (1-profit)
    res

// 止盈平仓条件
close_profit_position(long)=>
    bool result=false
    if long == true and profit_price>0 and profit_price*(1-profit_price_scale) >=close and  get_profit_price(true) <= close
        result:=true
    if long == false and profit_price>0 and profit_price*(1+profit_price_scale) <=close and  get_profit_price(false) >= close
        result:=true
    result

// 更新动态止盈价格
update_profit_price(price)=>
    float res = price
   // 无仓位时 动态止盈价格为0
    if strategy.position_size == 0
        res := 0
   // long - 价格大于最小收益时保存
    if strategy.position_size > 0 and get_profit_price(true) <= close and (res==0 or res < close)
        res := close
   // short - 价格小于最小收益时保存
    if strategy.position_size < 0 and get_profit_price(true) >= close and (res==0 or res > close)
        res := close
    res

///////


profit_price := update_profit_price(profit_price)
long_close_profit_position = close_profit_position(true)
short_close_profit_position = close_profit_position(false)

// plot(profit_price, color = color.green, title="profit_price")
//动态止盈end------------------------------------------------------------------------------------------


strategy.close("long",comment="long-止盈",when = strategy.position_size > 0 and long_close_profit_position)

strategy.close("long",comment="long-止损",when = strategy.position_size >0 and strategy.position_avg_price * (1-loss) >= close)

strategy.close("short",comment="short-止盈",when = strategy.position_size <0 and short_close_profit_position)

strategy.close("short",comment="short-止损",when = strategy.position_size <0 and strategy.position_avg_price * (1+loss) <= close)