পরিমাণগত কৌশল অনুসরণ করে দ্বৈত প্রবণতা

ওভারভিউ
এই কৌশলটির মূল ধারণাটি হল 123 বিপরীতমুখী কৌশল এবং রংধনু দোলক সূচকগুলির সংমিশ্রণ, কৌশলটির সাফল্যের হার বাড়ানোর জন্য দ্বৈত প্রবণতা ট্র্যাকিংয়ের জন্য। এই কৌশলটি স্বল্প ও মধ্যমেয়াদী মূল্যের প্রবণতা অনুসরণ করে, পজিশনগুলিকে গতিশীলভাবে সামঞ্জস্য করে এবং বড় প্যাকেজের বাইরে অতিরিক্ত উপার্জন অর্জন করে।
কৌশল নীতি
এই কৌশল দুটি অংশে বিভক্তঃ
-
123 বিপরীতমুখী কৌশলঃ যদি গত দুইদিনের ক্লোজিং মূল্য কমে যায় এবং আজকের ক্লোজিং মূল্য বেড়ে যায়, এবং 9 তারিখে Slow K লাইন 50 এর নিচে থাকে, তাহলে বেশি করুন; যদি গত দুইদিনের ক্লোজিং মূল্য বেড়ে যায় এবং আজকের ক্লোজিং মূল্য কমে যায়, এবং 9 তারিখে Fast K লাইন 50 এর উপরে থাকে, তাহলে খালি করুন।
-
রংধনু দোলক সূচকঃ এই সূচকটি মুভিং গড়ের তুলনায় দামের বিচ্যুতিকে প্রতিফলিত করে, যখন সূচকটি 80 এর উপরে থাকে, তখন বাজারটি অস্থিরতার দিকে ঝুঁকছে; যখন সূচকটি 20 এর নীচে থাকে, তখন বাজারটি বিপরীত দিকে ঝুঁকছে।
এই কৌশলটি উভয়কে একত্রিত করে এবং একই সাথে একটি অতিরিক্ত shorted সংকেত দেখা দিলে একটি অবস্থান খুলুন, অন্যথায় প্যাড করুন।
সামর্থ্য বিশ্লেষণ
এই কৌশলটির সুবিধাগুলো হলঃ
- ডাবল ফিল্টারিং, সংকেতের গুণমান উন্নত করে, ভুল বিচার হ্রাস করে।
- ডায়নামিকভাবে পজিশনে পরিবর্তন আনুন, একমুখী ট্রেডিংয়ের ক্ষতি হ্রাস করুন।
- সংক্ষিপ্ত ও মাঝারি মেয়াদী সূচকগুলিকে একত্রিত করা, কৌশলগত স্থিতিশীলতা বৃদ্ধি করা।
ঝুঁকি বিশ্লেষণ
এই কৌশলটি নিম্নলিখিত ঝুঁকিগুলিও বহন করেঃ
- ভুল প্যারামিটার অপ্টিমাইজেশনের ফলে ওভারফিট হতে পারে।
- ডাবল পজিশনে লেনদেনের খরচ বাড়বে।
- যখন কোন ট্রেডের দাম খুব বেশি ওঠানামা করে, তখন স্টপডোজ খুব সহজেই অতিক্রম করা যায়।
প্যারামিটার পরিবর্তন, পজিশন ম্যানেজমেন্টের অপ্টিমাইজেশান এবং যুক্তিসঙ্গতভাবে স্টপ লস সেট করার মাধ্যমে এই ঝুঁকিগুলি হ্রাস করা যেতে পারে।
অপ্টিমাইজেশান দিক
এই কৌশলটি নিম্নলিখিত দিকগুলি থেকে অপ্টিমাইজ করা যায়ঃ
- প্যারামিটারগুলিকে অপ্টিমাইজ করুন এবং সর্বোত্তম প্যারামিটার সমন্বয় খুঁজে বের করুন।
- পজিশন ম্যানেজমেন্ট মডিউল যোগ করা হয়েছে, যা অস্থিরতা এবং প্রত্যাহারের গতিশীলতার উপর ভিত্তি করে পজিশনগুলিকে সামঞ্জস্য করে।
- স্টপ লস মডিউল যুক্ত করুন, যুক্তিসঙ্গতভাবে মোবাইল স্টপ সেট করুন।
- মেশিন লার্নিং অ্যালগরিদম যুক্ত করা হয়েছে যা ট্রেন্ডের বিপর্যয় চিহ্নিত করতে সাহায্য করে।
সারসংক্ষেপ
এই কৌশলটি 123 টি বিপরীত কৌশল এবং রংধনু দোলক সূচককে সংহত করে, ডাবল ট্রেন্ড ট্র্যাকিং সক্ষম করে এবং উচ্চ স্থিতিশীলতা বজায় রেখে অতিরিক্ত উপার্জনের জন্য কিছু জায়গা রয়েছে। ক্রমাগত অপ্টিমাইজেশনের মাধ্যমে কৌশলটির আয় আরও বাড়ানোর সম্ভাবনা রয়েছে।
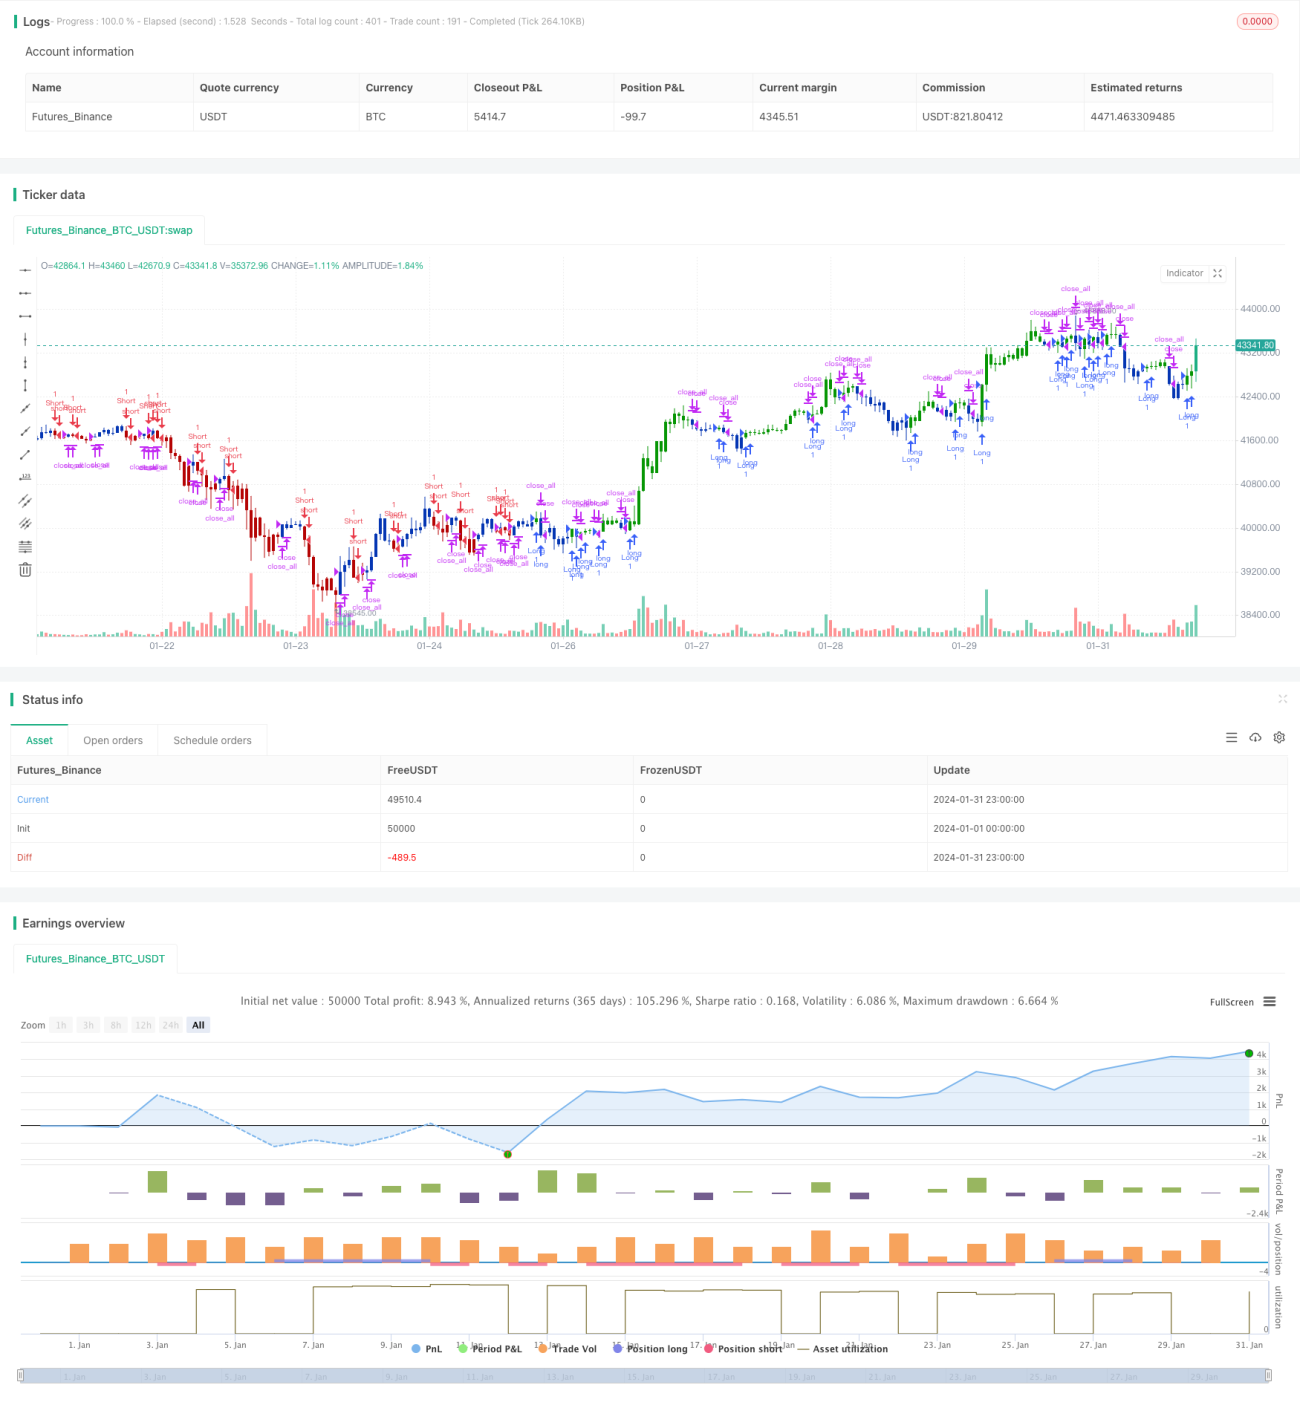
/*backtest
start: 2024-01-01 00:00:00
end: 2024-01-31 23:59:59
period: 1h
basePeriod: 15m
exchanges: [{"eid":"Futures_Binance","currency":"BTC_USDT"}]
*/

//@version=4
////////////////////////////////////////////////////////////
//  Copyright by HPotter v1.0 25/05/2021
// This is combo strategies for get a cumulative signal. - 1