Z-স্কোর এবং সুপার ট্রেন্ডের উপর ভিত্তি করে গতিশীল ট্রেডিং কৌশল: দীর্ঘ-সংক্ষিপ্ত সুইচিং সিস্টেম

ওভারভিউ
এই কৌশলটি একটি পরিমাপযোগ্য ট্রেডিং সিস্টেম যা Z- স্কোরের পরিসংখ্যানগত পদ্ধতি, তুলনামূলকভাবে দুর্বল সূচক (RSI) এবং সুপারট্রেন্ডের সূচক (সুপারট্রেন্ড) এর সমন্বয় করে। এই কৌশলটি মূল্যের পরিসংখ্যানগত বিচ্যুতি পর্যবেক্ষণ করে, গতিশীলতা সূচক এবং প্রবণতা নিশ্চিতকরণের সাথে মিলিত হয়, বাজারে উচ্চ সম্ভাব্যতার সুযোগগুলি সন্ধান করে। এই কৌশলটি কেবলমাত্র বাজারের ওভার-বিক্রয় ওভার-বিক্রয় সুযোগগুলিই ধরতে পারে না, তবে এটি প্রবণতা সনাক্তকরণের মাধ্যমে ভুয়া সংকেতগুলি ফিল্টার করতে পারে এবং বহু-বিভাগীয় দ্বি-মুখী বাণিজ্য অর্জন করতে পারে।
কৌশল নীতি
কৌশলটির কেন্দ্রীয় যুক্তিটি তিনটি প্রধান প্রযুক্তিগত সূচকের সমন্বয়মূলক কার্যকারিতার উপর ভিত্তি করে তৈরি করা হয়েছেঃ প্রথমত, 75-চক্রের চলমান গড় এবং স্ট্যান্ডার্ড ডিফারেনশিয়াল ব্যবহার করে দামের Z স্কোর গণনা করে বর্তমান দামের ঐতিহাসিক গড়ের থেকে বিচ্যুতি পরিমাপ করা হয়। যখন Z স্কোর 1.1 এর বেশি বা -1 .1 এর চেয়ে কম হয়, তখন দামের একটি উল্লেখযোগ্য পরিসংখ্যানগত বিচ্যুতি দেখা দেয়। দ্বিতীয়ত, RSI সূচকটি গতিশীলতা হিসাবে প্রবর্তন করা হয়, যা নিশ্চিত করে যে অবস্থান খোলার সময় RSI- এর সাথে সমন্বয় করা প্রয়োজন ((RSI> 60 মাল্টিহেডের সময়, RSI <40 শূন্য সময়ে) । অবশেষে, সুপার ট্রেন্ডিং সূচকটি ট্রেন্ডিং ফিল্টার হিসাবে ব্যবহৃত হয়, যা 11-চক্রের ATR এবং 2.0 এর গুণিতক গণনা করে। এই কৌশলটি কেবলমাত্র যখন তিনটি শর্ত পূরণ করে তখনই একটি ট্রেডিং সিগন্যাল দেয়।
কৌশলগত সুবিধা
- মাল্টি সিগন্যাল নিশ্চিতকরণঃ পরিসংখ্যান, গতিশীলতা এবং প্রবণতার তিনটি মাত্রার সমন্বয় দ্বারা ট্রেডিং সিগন্যালের নির্ভরযোগ্যতা ব্যাপকভাবে বৃদ্ধি পেয়েছে।
- অভিযোজনযোগ্যতা: Z স্কোরের হিসাব পদ্ধতি কৌশলকে বিভিন্ন বাজার পরিবেশে অভিযোজনযোগ্য করে তোলে, যা পরম মূল্য স্তরের প্রভাবিত হয় না।
- সুপার ট্রেন্ড ইন্ডিকেটর একটি স্বয়ংক্রিয় ট্রেন্ড ট্র্যাকিং এবং ঝুঁকি নিয়ন্ত্রণ ব্যবস্থা প্রদান করে।
- দ্বি-মুখী লেনদেনঃ কৌশলটি উভয় দিক থেকে সুযোগগুলি ধরতে সক্ষম, যা তহবিলের ব্যবহারের দক্ষতা বাড়ায়।
- সিগন্যালের স্বচ্ছতাঃ কৌশলটি সুস্পষ্ট গাণিতিক মডেল এবং উদ্দেশ্যমূলক সূচক ব্যবহার করে, যা বিষয়গত বিচার এড়ায়।
কৌশলগত ঝুঁকি
- পিছিয়ে পড়ার ঝুঁকিঃ একাধিক চক্রের চলমান গড় ব্যবহারের কারণে, কৌশলটি দ্রুত পরিবর্তিত বাজারে সংকেত পিছিয়ে পড়তে পারে।
- ভুয়া ব্রেকিংয়ের ঝুঁকিঃ ট্রান্সক্রিপশন মার্কেটে ভুয়া ব্রেকিংয়ের সংকেত ঘন ঘন দেখা দিতে পারে।
- প্যারামিটার সংবেদনশীলতা: কৌশলটির কার্যকারিতা প্যারামিটারগুলির পছন্দগুলির উপর অত্যন্ত নির্ভরশীল, বিভিন্ন বাজার পরিস্থিতিতে বিভিন্ন প্যারামিটার সেটিংয়ের প্রয়োজন হতে পারে।
- বাজারের অবস্থার উপর নির্ভরশীলতাঃ প্রবণতা অস্পষ্ট বাজারে, কৌশলটি অনুকূলভাবে কাজ করতে পারে না।
কৌশল অপ্টিমাইজেশনের দিকনির্দেশনা
- ডায়নামিক প্যারামিটার অ্যাডজাস্টমেন্টঃ স্বনির্ধারিত প্যারামিটার মেকানিজম চালু করা যেতে পারে, যা বাজারের ওঠানামা অনুযায়ী স্বয়ংক্রিয়ভাবে Z স্কোরের নিম্নমান এবং সুপারট্রেন্ডের প্যারামিটারগুলিকে সামঞ্জস্য করে।
- বাজার পরিবেশ ফিল্টার যুক্ত করুনঃ বাজার পরিবেশ সনাক্তকরণ মডিউল যুক্ত করুন, বিভিন্ন বাজার অবস্থার অধীনে বিভিন্ন প্যারামিটার সমন্বয় ব্যবহার করুন।
- ক্ষতি বন্ধ করার পদ্ধতি উন্নত করুনঃ গতিশীল ক্ষতি বন্ধ করার কৌশল যেমন এটিআর ভিত্তিক ক্ষতি বন্ধ বা ট্র্যাকিং ক্ষতি বন্ধ করুন।
- অপ্টিমাইজড সিগন্যাল ফিল্টারিংঃ ট্রেডিং সিগন্যাল আরও ফিল্টার করার জন্য ট্রানজাকশন কনফার্মেশন বা অন্যান্য প্রযুক্তিগত সূচক যুক্ত করা যেতে পারে।
- সময় ফিল্টারিং চালু করুনঃ ট্রেডিংয়ের সময়সীমা বাড়ানোর বিষয়ে বিবেচনা করুন এবং বড় ধরনের ওঠানামা এড়িয়ে চলুন।
সারসংক্ষেপ
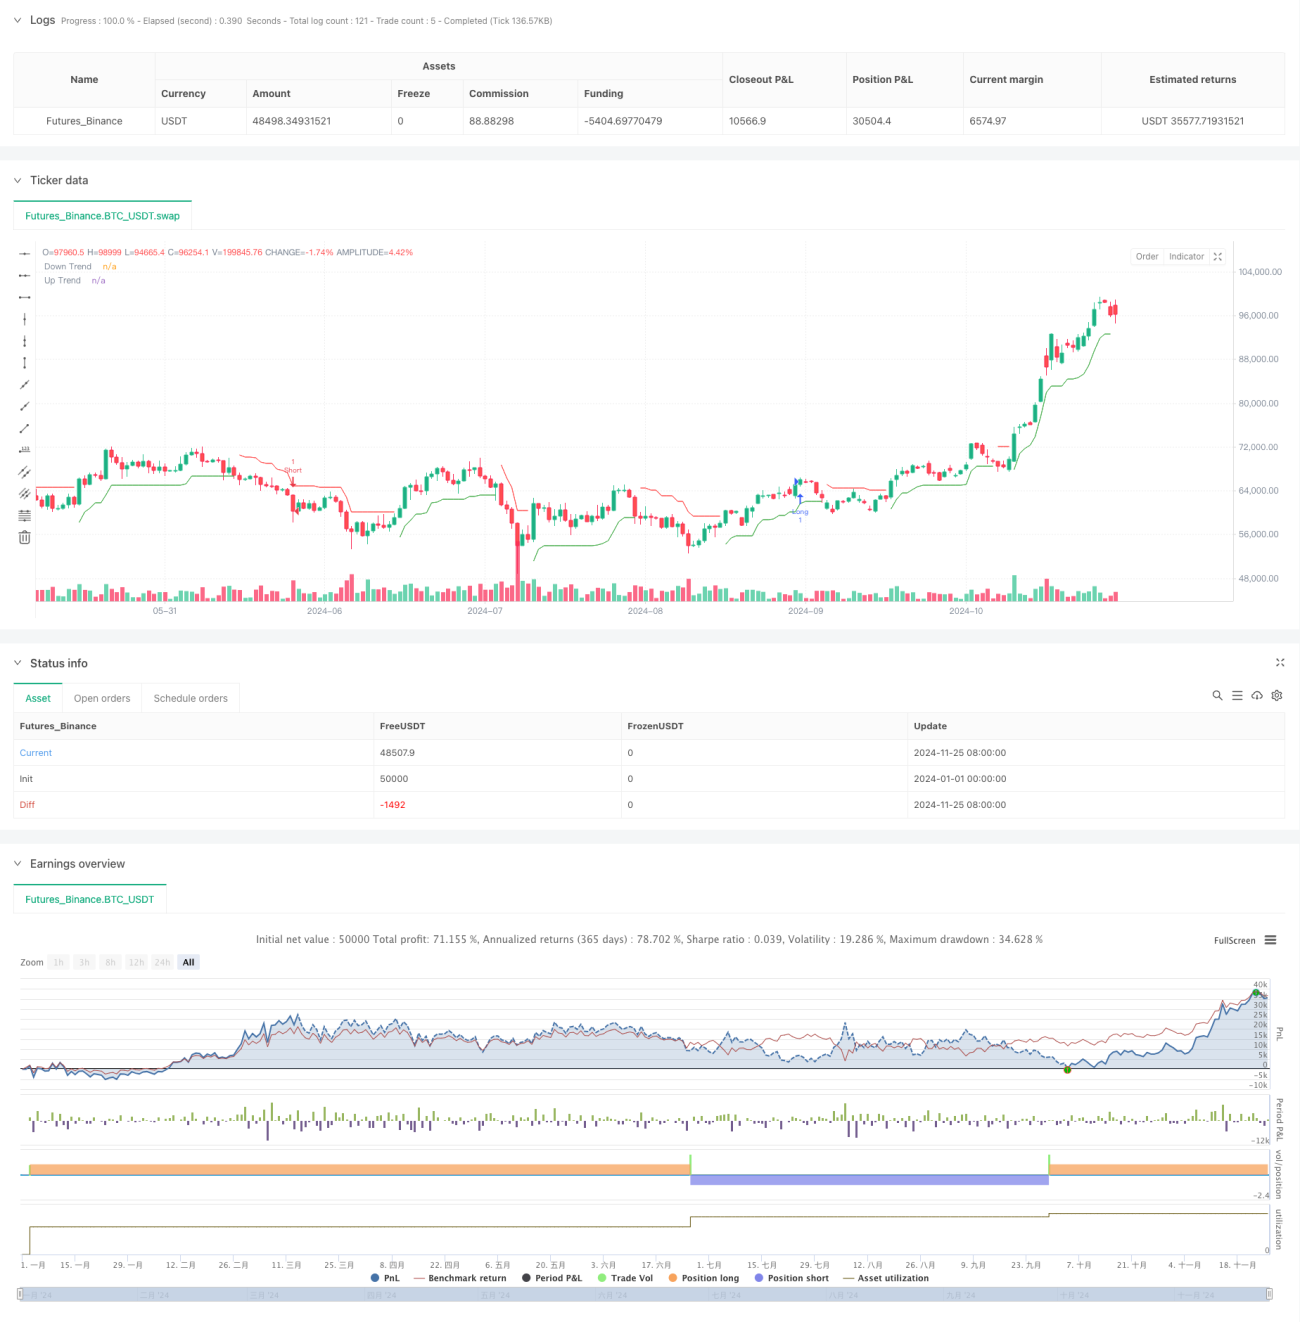
এটি একটি পরিসংখ্যানগত পদ্ধতি এবং প্রযুক্তিগত বিশ্লেষণের সমন্বিত একটি পরিমাণগত ট্রেডিং কৌশল যা একাধিক সংকেত নিশ্চিতকরণের মাধ্যমে লেনদেনের নির্ভরযোগ্যতা বাড়ায়। কৌশলটির মূল সুবিধাটি এর উদ্দেশ্যমূলক গাণিতিক মডেল এবং একটি উন্নত ঝুঁকি নিয়ন্ত্রণ ব্যবস্থা, তবে একই সাথে প্যারামিটার অপ্টিমাইজেশন এবং বাজার অভিযোজনযোগ্যতার বিষয়েও মনোযোগ দেওয়া দরকার। প্রস্তাবিত অপ্টিমাইজেশন দিকনির্দেশের মাধ্যমে, কৌশলটির আরও উন্নতির জন্য আরও জায়গা রয়েছে, বিশেষত বাজারের পরিবেশ এবং ঝুঁকি নিয়ন্ত্রণের সাথে গতিশীল অভিযোজন। এই কৌশলটি বড় অস্থিরতা এবং সুস্পষ্ট প্রবণতা সহ বাজারে ব্যবহারের জন্য উপযুক্ত।
- 1