বলিঞ্জার ব্যান্ড এবং আপেক্ষিক শক্তি সমন্বয় ট্রেডিং কৌশল

ওভারভিউ
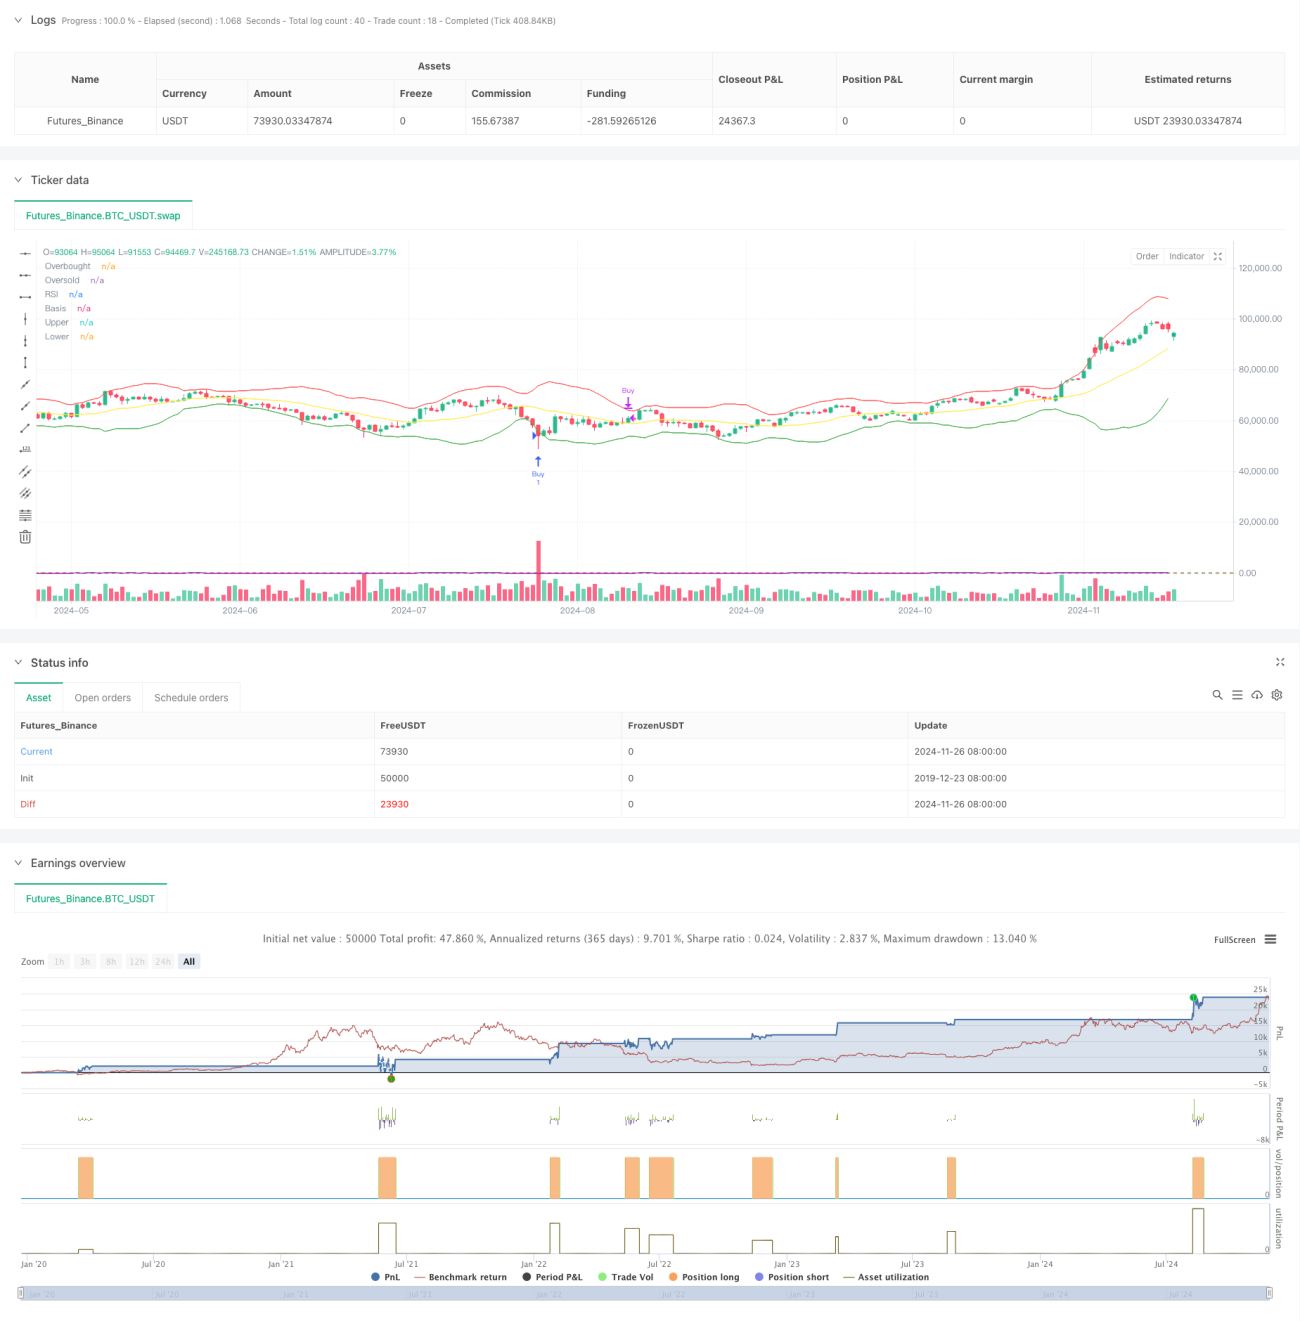
এই কৌশলটি একটি সম্পূর্ণ ট্রেডিং সিস্টেম গঠন করে, যা দুটি ক্লাসিক প্রযুক্তিগত সূচককে একত্রিত করে, পোলিনজার ব্যান্ডস এবং অপেক্ষাকৃত দুর্বল সূচক আরএসআই। কৌশলটি মূলত বাজারের অস্থিরতা এবং গতিশীলতার পরিবর্তনগুলি ক্যাপচার করে ব্যবসায়ের সুযোগের সন্ধান করে, বিশেষত দিনের ব্যবসায়ীদের ব্যবহারের জন্য উপযুক্ত। পোলিনের মাধ্যমে বাজারের অস্থিরতা পরিমাপ করা হয় এবং একই সাথে আরএসআই সূচকের সাথে দামের ওভারবাইট ওভারসোলের অবস্থা নিশ্চিত করার জন্য আরও নির্ভরযোগ্য ট্রেডিং সংকেত তৈরি করা হয়।
কৌশল নীতি
কৌশলটির মূল যুক্তি হল মূল্যের অস্থিরতার সূচকগুলিকে গতিশীলতার সূচকগুলির সাথে একত্রিত করা। পোলিন বন্ডটি 20 দিনের সরল চলমান গড়কে মধ্যম ট্র্যাক হিসাবে ব্যবহার করে এবং উপরের ট্র্যাকটি মধ্যম ট্র্যাকের সাথে 2.5 গুণ স্ট্যান্ডার্ড ডিফারেনশিয়াল হ্রাস করে। যখন দাম নিম্ন ট্র্যাকের সাথে যোগাযোগ করে এবং আরএসআই 30 এর নীচে থাকে, তখন সিস্টেমটি একটি মাল্টি-সিগন্যাল দেয়; যখন দামটি ট্র্যাকের বাইরে চলে যায় এবং আরএসআই 70 এর উপরে থাকে, তখন সিস্টেমটি একটি সমতল সংকেত দেয়।
কৌশলগত সুবিধা
- উচ্চ সংকেত নির্ভরযোগ্যতাঃ দুটি ভিন্ন মাত্রার প্রযুক্তিগত সূচকগুলির সমন্বয় দ্বারা ট্রেডিং সংকেতের নির্ভরযোগ্যতা ব্যাপকভাবে বৃদ্ধি পেয়েছে
- সুনির্দিষ্ট প্রবেশ ও প্রস্থান শর্তাবলী আবেগপ্রবণ ট্রেডিংয়ের প্রভাবকে কমিয়ে দেয়
- অভিযোজনযোগ্যতাঃ কৌশলগত প্যারামিটারগুলি বিভিন্ন বাজারের অবস্থার সাথে সামঞ্জস্যপূর্ণ হতে পারে
- অপারেশন লজিকের স্বচ্ছতাঃ ট্রেডিং নিয়মগুলি স্পষ্ট, সম্পাদন করা এবং পুনরাবৃত্তি করা সহজ
- যুক্তিসঙ্গত ঝুঁকি-লাভের অনুপাতঃ যুক্তিসঙ্গত স্টপ-অফ-লস শর্তগুলি সেট করে একটি ভাল ঝুঁকি-লাভের অনুপাত নিশ্চিত করা
কৌশলগত ঝুঁকি
- বাজারের ঝুঁকিঃ বাজারের তীব্র অস্থিরতার মধ্যে মিথ্যা সংকেত তৈরি হতে পারে
- ট্রেন্ডিং মার্কেটের ঝুঁকিঃ শক্তিশালী ট্রেন্ডিং মার্কেটে, আপনি কিছু জিনিস মিস করতে পারেন
- প্যারামিটার সংবেদনশীলতাঃ প্যারামিটার সেটিংসের প্রতি কৌশলগত প্রভাবগুলি সংবেদনশীল, যার জন্য ক্রমাগত অপ্টিমাইজেশন প্রয়োজন
- স্লাইড পয়েন্ট প্রভাবঃ কম তরলতাযুক্ত বাজারে বড় স্লাইড পয়েন্ট হতে পারে
- সিস্টেমিক ঝুঁকিঃ বাজারের অপ্রত্যাশিত ঘটনা কৌশল ব্যর্থ হতে পারে
কৌশল অপ্টিমাইজেশনের দিকনির্দেশনা
- গতিশীল প্যারামিটার অপ্টিমাইজেশানঃ পোলিন ব্যান্ডের প্যারামিটারগুলিকে বাজারের ওঠানামা অনুযায়ী গতিশীলভাবে সামঞ্জস্য করার কথা বিবেচনা করা যেতে পারে
- প্রবণতা ফিল্টার যুক্ত করুনঃ প্রবণতা বিচারক সূচকগুলি প্রবর্তন করুন, শক্তিশালী প্রবণতা বাজারে ভুল সংকেত এড়াতে
- ক্ষতিপূরণ ব্যবস্থা উন্নত করুনঃ আরও নমনীয় ক্ষতিপূরণ কৌশল ডিজাইন করুন এবং তহবিলের ব্যবহারের দক্ষতা বাড়ান
- অপ্টিমাইজড সিগন্যাল কনফার্মেশনঃ ট্র্যাফিকের পরিমাণ বাড়ানোর মতো সহায়ক সূচকগুলি সিগন্যাল নির্ভরযোগ্যতা বাড়ায়
- পজিশন কৌশল উন্নত করুনঃ লাভের লক্ষ্যমাত্রা এবং স্টপ লস শর্তাদি আরও ভালভাবে ডিজাইন করুন
সারসংক্ষেপ
এই কৌশলটি পোলিন ব্যান্ড এবং আরএসআই সূচকগুলির সাথে দক্ষতার সাথে একত্রিত করে একটি যুক্তিসঙ্গতভাবে কঠোর, অপারেশনাল ট্রেডিং সিস্টেম তৈরি করে। কৌশলটির প্রধান সুবিধা হ'ল সিগন্যালের নির্ভরযোগ্যতা, ঝুঁকি নিয়ন্ত্রণের দক্ষতা এবং শক্তিশালী অভিযোজনযোগ্যতা। যদিও কিছু বাজার পরিস্থিতিতে কিছু চ্যালেঞ্জের মুখোমুখি হতে পারে, তবে ক্রমাগত অপ্টিমাইজেশন এবং উন্নতির মাধ্যমে কৌশলটির সামগ্রিক পারফরম্যান্স এখনও ভাল ব্যবহারের মূল্য রয়েছে। ব্যবসায়ীদের পরামর্শ দেওয়া হয় যে তারা বাজারের পরিবেশের পরিবর্তনগুলি, কৌশলগত প্যারামিটারগুলিকে নমনীয়ভাবে সামঞ্জস্য করে এবং সর্বদা ঝুঁকি নিয়ন্ত্রণের জন্য ভালভাবে কাজ করে।
Overview
This strategy combines Bollinger Bands and Relative Strength Index (RSI) to form a comprehensive trading system. It primarily seeks trading opportunities by capturing market volatility and momentum changes, particularly suitable for intraday traders. The strategy uses Bollinger Bands to measure market volatility while incorporating RSI to confirm overbought and oversold conditions, generating more reliable trading signals.
Strategy Principles
The core logic combines volatility and momentum indicators. Bollinger Bands consist of a 20-day simple moving average as the middle band, with upper and lower bands set at 2.5 standard deviations. Buy signals are generated when price touches the lower band and RSI is below 30, while exit signals occur when price breaks above the upper band and RSI exceeds 70. Additionally, the strategy includes an extra exit condition when RSI rises above 50, helping to secure profits. The design thoroughly considers market volatility characteristics and price momentum patterns.
Strategy Advantages
- High Signal Reliability: Combining two different technical indicators significantly improves trading signal reliability
- Comprehensive Risk Control: Clear entry and exit conditions effectively reduce emotional trading
- Strong Adaptability: Strategy parameters can be flexibly adjusted for different market conditions
- Clear Operational Logic: Trading rules are explicit, easy to execute and backtest
- Reasonable Risk-Reward Ratio: Appropriate profit-taking and stop-loss conditions ensure a favorable risk-reward ratio
Strategy Risks
- Choppy Market Risk: May generate false signals in highly volatile market conditions
- Trend Market Risk: Might miss some opportunities in strong trending markets
- Parameter Sensitivity: Strategy performance is sensitive to parameter settings, requiring continuous optimization
- Slippage Impact: May face significant slippage in markets with poor liquidity
- Systematic Risk: Market emergencies may cause strategy failure
Strategy Optimization Directions
- Dynamic Parameter Optimization: Consider dynamically adjusting Bollinger Bands parameters based on market volatility
- Add Trend Filters: Introduce trend identification indicators to avoid false signals in strong trending markets
- Improve Stop Loss Mechanism: Design more flexible stop-loss strategies to enhance capital efficiency
- Optimize Signal Confirmation: Add volume and other auxiliary indicators to improve signal reliability
- Enhance Exit Strategy: Design more detailed profit targets and stop-loss conditions
Summary
The strategy cleverly combines Bollinger Bands and RSI indicators to build a logically rigorous and highly operable trading system. Its main advantages lie in high signal reliability and comprehensive risk control, while maintaining strong adaptability. Although it may face challenges in certain market environments, the strategy maintains good practical value through continuous optimization and improvement. Traders should pay attention to changing market conditions, flexibly adjust strategy parameters, and always maintain proper risk control in practical applications.
- 1