একাধিক মুভিং এভারেজ ট্রেন্ড মোমেন্টাম ক্রসওভার ট্রেডিং সিস্টেম

ওভারভিউ
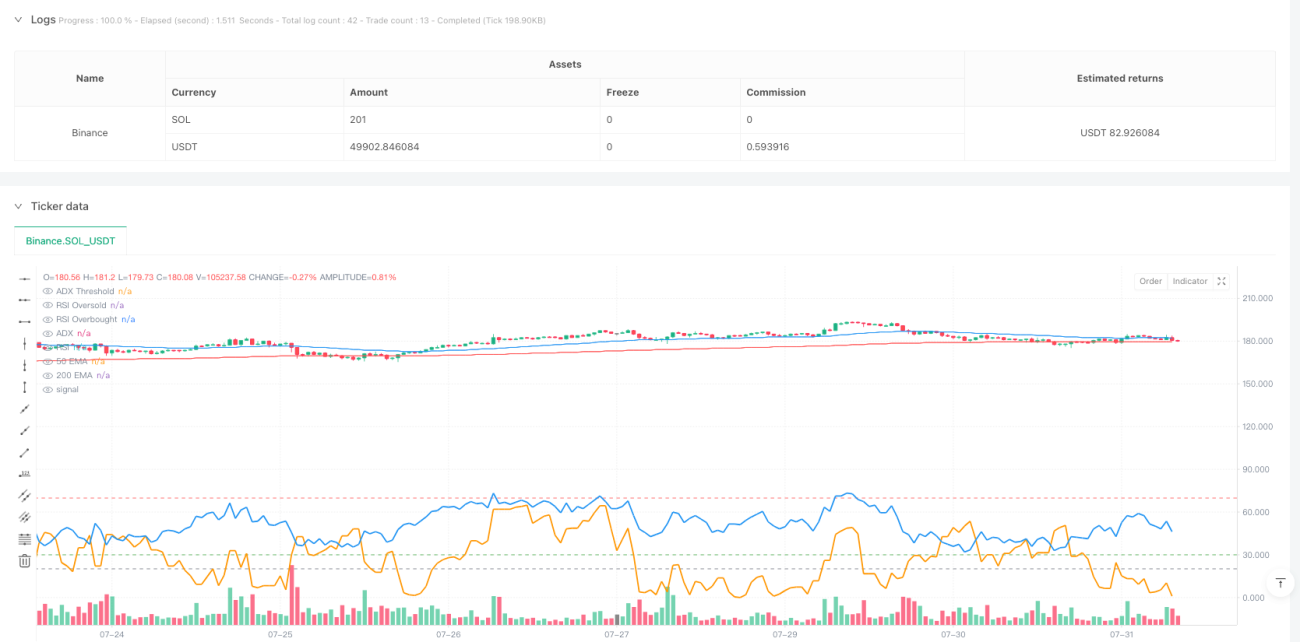
এই কৌশলটি একটি প্রবণতা ট্র্যাকিং সিস্টেম যা একাধিক প্রযুক্তিগত সূচকগুলির উপর ভিত্তি করে তৈরি করা হয়, যা চলমান গড় (EMA), গড় প্রবণতা সূচক (ADX) এবং অপেক্ষাকৃত দুর্বল সূচক (RSI) এর সুবিধাগুলিকে একত্রিত করে। 50 এবং 200 দিনের সূচকগুলির চলমান গড়ের ক্রস দ্বারা বাজারের প্রবণতা সনাক্ত করার জন্য, যখন ADX- এর দুর্বল প্রবণতাগুলিকে ফিল্টার করা হয় এবং RSI ব্যবহার করে অতিরিক্ত ক্রয় বা অতিরিক্ত বিক্রয় এড়ানোর জন্য ট্রেড করা হয়। কৌশলটি গতিশীল স্টপ লস এবং লাভের লক্ষ্যমাত্রা গ্রহণ করে যা প্রকৃত তরঙ্গের উপর ভিত্তি করে (ATR), যা ঝুঁকি নিয়ন্ত্রণ এবং লাভের সর্বাধিকীকরণ উভয়ই নিশ্চিত করে।
কৌশল নীতি
কৌশলটির মূল যুক্তি নিম্নলিখিত মূল উপাদানগুলির উপর ভিত্তি করে:
- প্রবণতা নির্ণয়ঃ দ্রুত EMA ((50 দিন) এবং ধীর EMA ((200 দিন) এর ক্রস ব্যবহার করে বাজারের প্রবণতার দিক নির্ধারণ করুন। যখন 50 তম EMA 200 তম EMA অতিক্রম করে, তখন একটি উত্থান প্রবণতা প্রবেশ করে; যখন 50 তম EMA 200 তম EMA অতিক্রম করে তখন একটি পতন প্রবণতা প্রবেশ করে।
- প্রবণতা শক্তি নিশ্চিতকরণঃ প্রবণতা শক্তি পরিমাপ করার জন্য ADX সূচক ব্যবহার করুন, শুধুমাত্র যখন ADX মান 20 এর চেয়ে বড় হয় তখনই প্রবেশের বিষয়টি বিবেচনা করুন, কেবলমাত্র শক্তিশালী প্রবণতাগুলির মধ্যে বাণিজ্য নিশ্চিত করুন।
- গতিশীলতা ফিল্টারঃ আরএসআই সূচক দ্বারা গতিশীলতা ফিল্টার করুন, কেবলমাত্র যখন আরএসআই 30-70 এর মধ্যে থাকে তখনই পজিশন খুলুন, অতিরিক্ত ক্রয় বা অতিরিক্ত বিক্রয় অঞ্চলগুলি এড়াতে।
- ঝুঁকি ব্যবস্থাপনাঃ এটিআর-ভিত্তিক গতিশীল স্টপ লস এবং লাভের লক্ষ্যমাত্রা ব্যবহার করুন, স্টপ লস 2x এটিআর এবং লাভের লক্ষ্যমাত্রা 4x এটিআর সেট করুন।
কৌশলগত সুবিধা
- বহু-মাত্রিক প্রবণতা নিশ্চিতকরণঃ সমান্তরাল ক্রস, ADX এবং RSI ট্রিপল ফিল্টারিংয়ের সমন্বয়ে ট্রেডিং সিগন্যালের নির্ভরযোগ্যতা উল্লেখযোগ্যভাবে বৃদ্ধি পেয়েছে।
- গতিশীল ঝুঁকি ব্যবস্থাপনাঃ এটিআর-ভিত্তিক গতিশীল স্টপ লস এবং লাভের সেটিং যা বাজারের অস্থিরতার সাথে খাপ খাইয়ে নিতে সক্ষম।
- দুর্বল প্রবণতা ফিল্টার করুনঃ ADX সূচক প্রবর্তন কার্যকরভাবে ক্রসওভার বাজারে ঘন ঘন লেনদেন এড়ানো হয়েছে।
- আরএসআই ফিল্টারিং সিস্টেমটি চরম অঞ্চলে লেনদেন এড়াতে সহায়তা করে।
কৌশলগত ঝুঁকি
- প্রবণতা বিপরীত ঝুঁকিঃ দ্রুত বিপরীতমুখী ট্রেডিংয়ের সময়, গড়রেখার সিস্টেমের পিছিয়ে থাকা একটি বড় প্রত্যাহারের কারণ হতে পারে।
- বাজারের ঝড়ের ঝুঁকিঃ বাজারের মধ্যে ঝড়ের সময়, প্রায়শই মিথ্যা ব্রেকিং সিগন্যাল তৈরি হতে পারে।
- প্যারামিটার সংবেদনশীলতাঃ বিভিন্ন বাজারের পরিস্থিতিতে একাধিক সূচকের প্যারামিটার সেটিং অপ্টিমাইজ করা প্রয়োজন।
- স্লাইড পয়েন্টের ঝুঁকিঃ কম তরল বাজারে, প্রকৃত লেনদেনের দামগুলি সংকেত মূল্যের চেয়ে বেশি বিচ্যুত হতে পারে।
কৌশল অপ্টিমাইজেশনের দিকনির্দেশনা
- লেনদেনের পরিমাণের সূচক প্রবর্তন করাঃ লেনদেনের পরিমাণ নিশ্চিত করার জন্য একটি পদ্ধতি যুক্ত করার কথা বিবেচনা করা যেতে পারে। লেনদেন কেবলমাত্র যখন লেনদেনের পরিমাণটি অতিক্রম করা হয় তখনই করা হয়।
- অপ্টিমাইজ করা স্টপ লসঃ ট্রেডিং স্টপ লস ব্যবহার করা বিবেচনা করা যেতে পারে, যা ট্রেন্ডের বিকাশের সময় সুরক্ষিত থাকে।
- সময় ফিল্টার যুক্ত করুনঃ ট্রেডিংয়ের সময় ফিল্টার যুক্ত করুন, যাতে ট্রেডিংয়ের সময় বেশি অস্থিরতা থাকে।
- বাজার পরিবেশের শ্রেণিবিন্যাসঃ বিভিন্ন বাজার পরিবেশের উপর ভিত্তি করে গতিশীলভাবে কৌশলগত প্যারামিটারগুলিকে সামঞ্জস্য করুন (প্রবণতা, কম্পন) ।
সারসংক্ষেপ
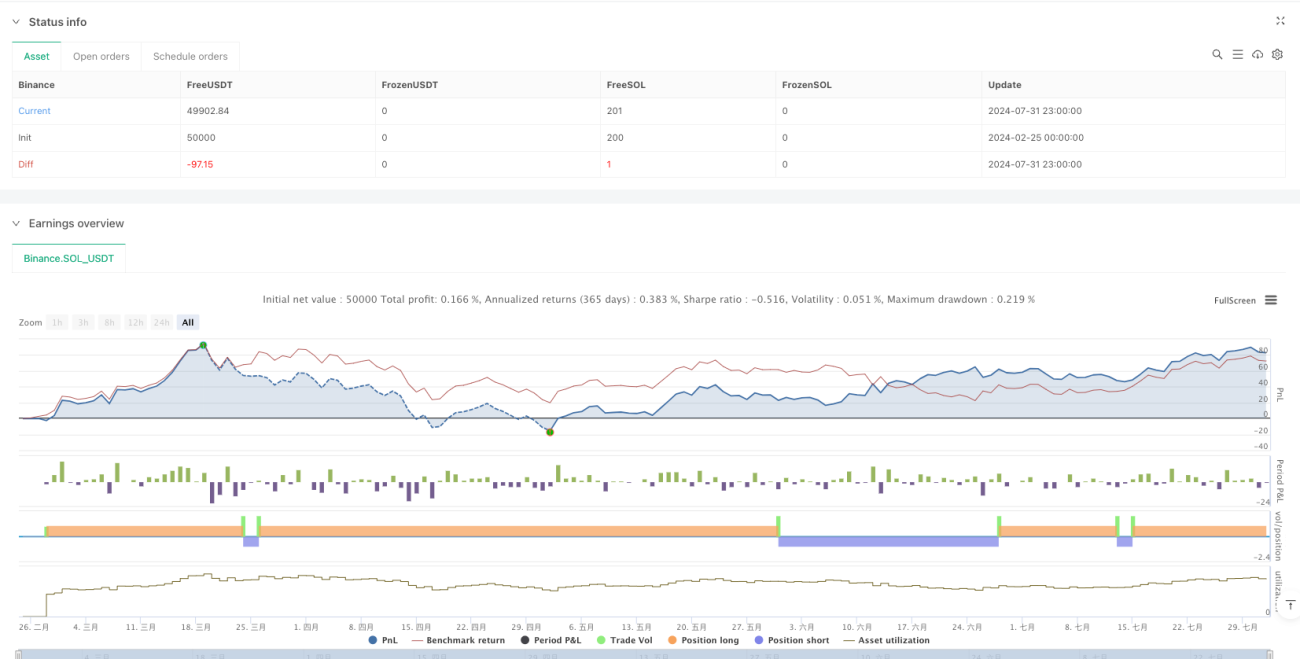
এই কৌশলটি একাধিক প্রযুক্তিগত সূচকগুলির সমন্বিত ব্যবহারের মাধ্যমে একটি সম্পূর্ণ প্রবণতা ট্র্যাকিং ট্রেডিং সিস্টেম তৈরি করে। কৌশলটির সুবিধা হল মাল্টি-ডাইমেনশনাল সিগন্যাল নিশ্চিতকরণ ব্যবস্থা এবং গতিশীল ঝুঁকি ব্যবস্থাপনা ব্যবস্থা, তবে একই সাথে প্রবণতা বিপরীতকরণ এবং অস্থির বাজারের ঝুঁকির বিষয়েও মনোযোগ দেওয়া প্রয়োজন। ক্রমাগত অপ্টিমাইজেশন এবং পরিমার্জনের মাধ্যমে, কৌশলটি বিভিন্ন বাজারের পরিবেশে স্থিতিশীল পারফরম্যান্স বজায় রাখার সম্ভাবনা রয়েছে।
Overview
This strategy is a trend-following system based on multiple technical indicators, combining the advantages of Exponential Moving Averages (EMA), Average Directional Index (ADX), and Relative Strength Index (RSI). It identifies market trends through the crossover of 50-day and 200-day EMAs, filters weak trends using ADX, and avoids trading in overbought or oversold areas using RSI. The strategy employs dynamic stop-loss and take-profit targets based on Average True Range (ATR), ensuring both risk control and profit maximization.
Strategy Principles
The core logic of the strategy is built on the following key elements:
- Trend Identification: Uses the crossover of fast EMA (50-day) and slow EMA (200-day) to determine market trend direction. A bullish trend is signaled when the 50-day EMA crosses above the 200-day EMA, and a bearish trend when it crosses below.
- Trend Strength Confirmation: Utilizes the ADX indicator to measure trend strength, only considering entry when ADX is above 20, ensuring trades only in strong trends.
- Momentum Filtering: Applies RSI indicator for momentum filtering, only entering positions when RSI is between 30-70, avoiding trades in overbought or oversold areas.
- Risk Management: Uses ATR-based dynamic stop-loss and take-profit levels, with stop-loss set at 2x ATR and take-profit at 4x ATR.
Strategy Advantages
- Multi-dimensional Trend Confirmation: Combines EMA crossover, ADX, and RSI triple filtering to significantly improve signal reliability.
- Dynamic Risk Management: ATR-based dynamic stop-loss and take-profit settings adapt to market volatility.
- Weak Trend Filtering: Introduction of ADX effectively avoids frequent trading in ranging markets.
- Prevention of Extreme Entries: RSI filtering mechanism prevents trading in extreme areas.
Strategy Risks
- Trend Reversal Risk: The lag in moving average systems may lead to significant drawdowns in quick reversal scenarios.
- Range-bound Market Risk: May generate frequent false breakout signals during sideways markets.
- Parameter Sensitivity: Multiple indicator parameters need optimization across different market conditions.
- Slippage Risk: Actual execution prices may significantly deviate from signal prices in less liquid markets.
Strategy Optimization Directions
- Volume Indicator Integration: Consider adding volume confirmation, only trading on volume breakouts.
- Stop-loss Mechanism Enhancement: Consider implementing trailing stops to protect profits during trend development.
- Time Filter Addition: Add trading time filters to avoid high-volatility periods.
- Market Environment Classification: Dynamically adjust strategy parameters based on different market conditions (trending, ranging).
Summary
The strategy constructs a comprehensive trend-following trading system through the integrated use of multiple technical indicators. Its strengths lie in multi-dimensional signal confirmation and dynamic risk management systems, while attention must be paid to risks from trend reversals and ranging markets. Through continuous optimization and refinement, the strategy has the potential to maintain stable performance across different market environments.
- 1