Supertrend-Strategie basierend auf ATR und Trailing Stop


Erstellungsdatum: 2023-11-28 14:56:59 zuletzt geändert: 2023-11-28 14:56:59
Kopie: 0 Klicks: 939
1
konzentrieren Sie sich auf
1617
Anhänger

Supertrend-Strategie basierend auf ATR und Trailing Stop

Überblick

Diese Strategie basiert auf dem Indikator der durchschnittlichen realen Schwankungsbreite (ATR) und entwirft eine bewegliche Stop-Loss- und Umkehrlinie. Sie verfolgt den Trailing-Stop-Loss, d. h. die Anpassung der Stop-Loss-Linie, entsprechend der Preisänderung. Insbesondere bewegt sich die Stop-Loss-Linie im festen Verhältnis in Richtung Gewinn, wenn der Preis um mehr als 1% wechselt.

Strategieprinzip

Die Strategie berechnet die Stop-Line mit dem ATR-Indikator. Die spezifische Formel lautet:

atr = multplierFactor * atr(barsBack)

longStop = hl2 - atr 
shortStop = hl2 + atr

Der MultiplierFactor ist der ATR-Vergrößerungsfaktor, der Bar-Back ist die Anzahl der ATR-Zyklen. Je größer der ATR, desto größer ist die Marktfluktuation.

Die LongStop- und ShortStop-Stop-Linien werden anhand der ATR-Werte berechnet. Wenn der Preis diese beiden Linien überschreitet, wird ein Handelssignal ausgegeben.

Darüber hinaus führt die Strategie eine “Direction” -Variable ein, um die Richtung des Trends zu bestimmen:

direction = 1
direction := nz(direction[1], direction) 
direction := direction == -1 and close > shortStopPrev ? 1 : direction == 1 and close < longStopPrev ? -1 : direction

Wenn die Richtung 1 ist, ist es in einem mehrköpfigen Trend, wenn die Richtung -1 ist, ist es in einem ungebundenen Trend.

Die Stop-Line wird in verschiedenen Farben angezeigt, je nachdem, wie die Richtung variiert:

if (direction == 1)
    valueToPlot := longStop
    colorToPlot := color.green 
else
    valueToPlot := shortStop
    colorToPlot := color.red

Auf diese Weise kann man die Richtung des aktuellen Trends und die Position der Stop-Line deutlich sehen.

Verfolgung von Stop-Loss-Mechanismen

Der Schlüssel zur Strategie besteht in der Einführung eines Stop-Tracking-Mechanismus, der die Stop-Line in Echtzeit an die Preisentwicklung anpasst.

Die Logik lautet wie folgt:

strategyPercentege = (close - updatedEntryPrice) / updatedEntryPrice * 100.00
rideUpStopLoss = hasOpenTrade() and strategyPercentege > 1

if (rideUpStopLoss) 
    stopLossPercent := stopLossPercent + strategyPercentege - 1.0
    newStopLossPrice = updatedEntryPrice + (updatedEntryPrice * stopLossPercent) / 100
    stopLossPrice := max(stopLossPrice, newStopLossPrice)
    updatedEntryPrice := stopLossPrice

Wenn der Preis im Vergleich zum Einstiegspreis um mehr als 1% gestiegen ist, wird die Stop-Loss-Linie nach oben verfolgt. Die Bereinigung der Breite beträgt mehr als 1%.

Das bedeutet, dass mehr Gewinne gesichert werden können, während gleichzeitig weniger Verluste entstehen.

Analyse der Stärken

Der größte Vorteil dieser Strategie gegenüber herkömmlichen mobilen Stop-Loss-Strategien besteht darin, dass die Stop-Lines dynamisch an die Marktbedingungen angepasst werden können. Die spezifischen Vorteile sind wie folgt:

  1. Das Unternehmen ist in der Lage, die Gewinne im Trend zu lockern.

Der Tracking-Stop-Mechanismus lässt die Stop-Line kontinuierlich in Richtung Gewinn bewegen, um höhere Gewinne zu sichern, wenn die Marktentwicklung weiter wächst.

  1. Das ist eine sehr wichtige Entscheidung, um die Verluste zu reduzieren.

Die Strategie basiert auf der Berechnung der Marktvolatilität und kann die Preisänderungen vernünftigerweise verfolgen, um zu vermeiden, dass die Stop-Losses bei der Bilanzierung übersprungen werden.

  1. Einfach zu bedienen und leicht zu automatisieren

Die Strategie basiert ausschließlich auf Indikatoren und ist ohne komplizierte Trend-Beurteilung-Logik.

  1. Anpassbare Parameter für verschiedene Sorten

Die ATR-Periode, der Vergrößerungsprozess und die Stop-Loss-Marge können individuell angepasst werden, um die Strategie für verschiedene Sorten zu optimieren.

Risikoanalyse

Obwohl diese Strategie viele Vorteile hat, gibt es folgende Risiken:

  1. Es ist unmöglich, einen Trendwendepunkt zu bestimmen, es besteht die Gefahr, dass es nach oben oder unten geht.

Die Strategie beurteilt nicht die Logik des Endes eines Trends.

  1. Fehlgelegte Parameter können den Verlust vergrößern

Wenn die ATR-Zyklusparameter zu kurz eingestellt sind, ist die Stop-Line zu empfindlich und kann durch häufige Erschütterungen ausgelöst werden.

  1. Es besteht die Gefahr, dass die Kopie von Reboots zerstört wird.

Die Strategie berücksichtigt nicht die Diversifizierungspunkte als Stop-Loss-Unterstützungspunkte. Daher kann die Kurzlinie bei einer Rebound-Rebellion aus dem Markt geworfen werden.

Für die oben genannten Risiken können Optimierungen in folgenden Bereichen vorgenommen werden:

  1. In Kombination mit Trendwellen-Indikatoren kann eine Trendwende vorweggenommen werden.

  2. Parameteroptimierungstests zur Auswahl der optimalen Parameterkombination

  3. Weiterer Stop-Loss-Bereich in der Nähe von bestimmten Unterstützungswerten

Optimierungsrichtung

Die Strategie kann noch weiter optimiert werden:

  1. K-Linien-Form-Beschluss

Die Wahrscheinlichkeit einer Trendwende kann durch die Identifizierung einiger typischer K-Linie-Formen, wie Rücken, Sternschnuppen usw. beurteilt werden. Dies vermeidet die Gefahr, nach den Höhen und Tiefen zu jagen.

  1. Optimierung der Parameter für dynamische Tracking

Die ATR-Zyklus, die Vergrößerung des Koeffizienten und andere Parameter können dynamisch verändert werden, um einen längeren ATR-Zyklus und eine breitere Stop-Loss-Spanne in stark volatilen Märkten zu verwenden.

  1. Mit Hilfe eines Modells für maschinelles Lernen

Mit Hilfe von Deep-Learning-Modellen wie lstm, rnn, etc. wird die mögliche Preisspanne im Aftermarket vorhergesagt und die Stop-Loss-Distanz dynamisch angepasst.

Zusammenfassen

Die Strategie überall nutzt die ATR-Indikatoren, um eine mobile Stop-Line zu entwerfen und einen Stop-Tracking-Mechanismus einzuführen, der die Stop-Loss-Verlagerung in Echtzeit an die Marktentwicklung anpasst. Dies ermöglicht eine höhere Gewinnsperre und verringert gleichzeitig das Risiko. Durch weitere Optimierungen kann die Strategie besser an verschiedene Marktbedingungen angepasst werden und zu einer universell anpassungsfähigen Handelsstrategie werden.
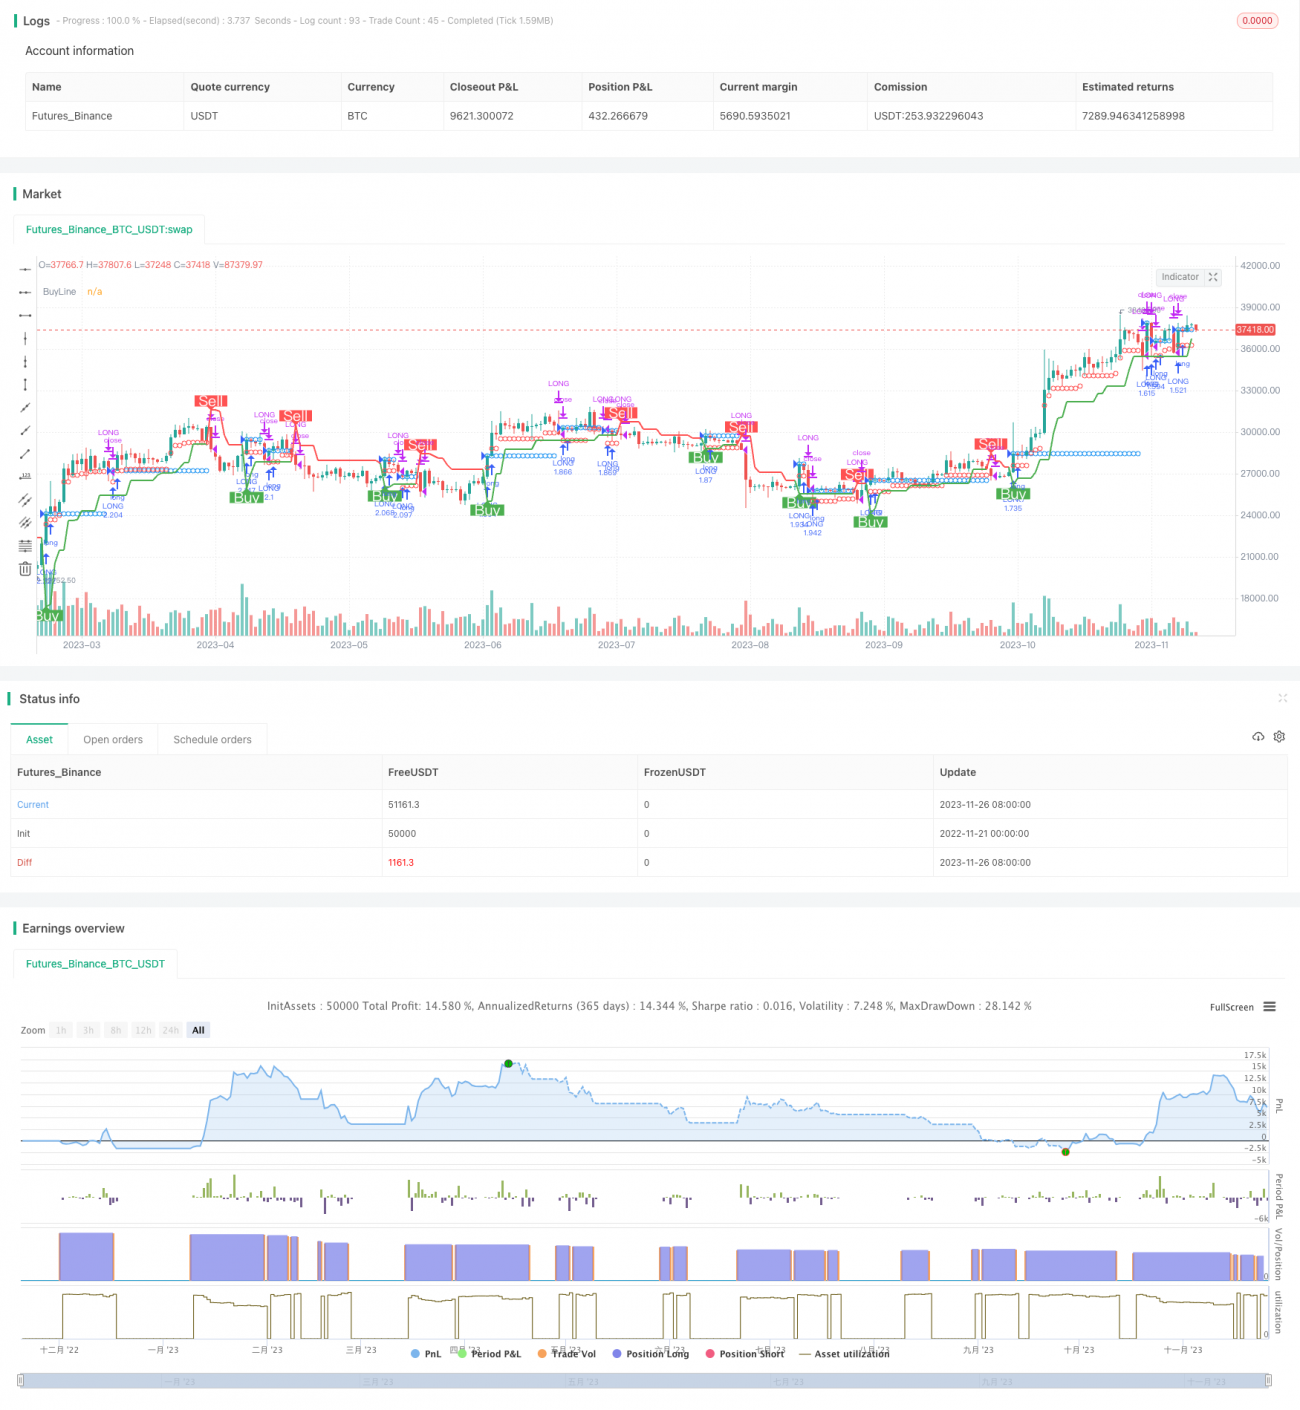
Strategiequellcode
/*backtest
start: 2022-11-21 00:00:00
end: 2023-11-27 00:00:00
period: 1d
basePeriod: 1h
exchanges: [{"eid":"Futures_Binance","currency":"BTC_USDT"}]
*/

//@version=4
//
// ▒▒▒▒▒▒▒▒▒▒▒▒▒▒▒▒▒▒▒▒▒▒▒▒▒▒▒▒▒▒▒▒▒▒▒▒▒▒▒▒▒▒▒▒▒▒▒▒▒▒▒▒▒▒▒▒▒▒▒▒▒▒▒▒▒▒▒▒▒▒▒▒▒▒▒▒▒▒▒▒▒▒▒▒▒▒▒▒▒▒▒▒▒▒▒▒▒▒▒▒▒▒▒▒▒▒▒▒▒▒▒▒▒▒ 
//  -----------------------------------------------------------------------------
//  Copyright 2019 Mauricio Pimenta | exit490
//  SuperTrend with Trailing Stop Loss script may be freely distributed under the MIT license.
//
//  Permission is hereby granted, free of charge, 
//  to any person obtaining a copy of this software and associated documentation files (the "Software"), 
//  to deal in the Software without restriction, including without limitation the rights to use, copy, modify, merge, 
//  publish, distribute, sublicense, and/or sell copies of the Software, and to permit persons to whom the Software is furnished to do so, 
//  subject to the following conditions:
//
//  The above copyright notice and this permission notice shall be included in all copies or substantial portions of the Software.
//
//  THE SOFTWARE IS PROVIDED "AS IS", WITHOUT WARRANTY OF ANY KIND, 
//  EXPRESS OR IMPLIED, INCLUDING BUT NOT LIMITED TO THE WARRANTIES OF MERCHANTABILITY, 
//  FITNESS FOR A PARTICULAR PURPOSE AND NONINFRINGEMENT. IN NO EVENT SHALL THE AUTHORS OR COPYRIGHT HOLDERS BE LIABLE FOR ANY CLAIM, 
//  DAMAGES OR OTHER LIABILITY, WHETHER IN AN ACTION OF CONTRACT, TORT OR OTHERWISE, ARISING FROM, 
//  OUT OF OR IN CONNECTION WITH THE SOFTWARE OR THE USE OR OTHER DEALINGS IN THE SOFTWARE.
//
//  -----------------------------------------------------------------------------
//
//  Authors:  @exit490
//  Revision: v1.0.0
//  Date:     5-Aug-2019
//
//  Description
//  ===========
//  SuperTrend is a moving stop and reversal line based on the volatility (ATR).
//  The strategy will ride up your stop loss when price moviment 1%.
//  The strategy will close your operation when the market price crossed the stop loss.
//  The strategy will close operation when the line based on the volatility will crossed
//
//  The strategy has the following parameters:
//
//  INITIAL STOP LOSS - Where can isert the value to first stop.
//  POSITION TYPE - Where can to select trade position.
//  ATR PERIOD - To select number of bars back to execute calculation
//  ATR MULTPLIER - To add a multplier factor on volatility
//  BACKTEST PERIOD - To select range.
//  
//  -----------------------------------------------------------------------------
//  Disclaimer:
//    1. I am not licensed financial advisors or broker dealers. I do not tell you 
//       when or what to buy or sell. I developed this software which enables you 
//       execute manual or automated trades multplierFactoriplierFactoriple trades using TradingView. The 
//       software allows you to set the criteria you want for entering and exiting 
//       trades.
//    2. Do not trade with money you cannot afford to lose.
//    3. I do not guarantee consistent profits or that anyone can make money with no 
//       effort. And I am not selling the holy grail.
//    4. Every system can have winning and losing streaks.
//    5. Money management plays a large role in the results of your trading. For 
//       example: lot size, account size, broker leverage, and broker margin call 
//       rules all have an effect on results. Also, your Take Profit and Stop Loss 
//       settings for individual pair trades and for overall account equity have a 
//       major impact on results. If you are new to trading and do not understand 
//       these items, then I recommend you seek education materials to further your
//       knowledge.
//
//    YOU NEED TO FIND AND USE THE TRADING SYSTEM THAT WORKS BEST FOR YOU AND YOUR 
//    TRADING TOLERANCE.
//
//    I HAVE PROVIDED NOTHING MORE THAN A TOOL WITH OPTIONS FOR YOU TO TRADE WITH THIS PROGRAM ON TRADINGVIEW.
//    
//    I accept suggestions to improve the script.
//    If you encounter any problems I will be happy to share with me.
//  -----------------------------------------------------------------------------
//
// ▒▒▒▒▒▒▒▒▒▒▒▒▒▒▒▒▒▒▒▒▒▒▒▒▒▒▒▒▒▒▒▒▒▒▒▒▒▒▒▒▒▒▒▒▒▒▒▒▒▒▒▒▒▒▒▒▒▒▒▒▒▒▒▒▒▒▒▒▒▒▒▒▒▒▒▒▒▒▒▒▒▒▒▒▒▒▒▒▒▒▒▒▒▒▒▒▒▒▒▒▒▒▒▒▒▒▒▒▒▒▒▒▒▒ //

strategy(title = "SUPERTREND ATR WITH TRAILING STOP LOSS",
         shorttitle = "SUPERTREND ATR WITH TSL",
         overlay = true,
         precision = 8,
         calc_on_order_fills = true,
         calc_on_every_tick = true,
         backtest_fill_limits_assumption = 0,
         default_qty_type = strategy.percent_of_equity,
         default_qty_value = 100,
         initial_capital = 1000,
         currency = currency.USD,
         linktoseries = true)

//
// ▒▒▒▒▒▒▒▒▒▒▒▒▒▒▒▒▒▒▒▒▒▒▒▒▒▒▒▒▒▒▒▒▒▒▒▒▒▒▒▒▒▒▒▒▒▒▒▒▒▒▒▒▒▒▒▒▒▒▒▒▒▒▒▒▒▒▒▒▒▒▒▒▒▒▒▒▒▒▒▒▒▒▒▒▒▒▒▒▒▒▒▒▒▒▒▒▒▒▒▒▒▒▒▒▒▒▒▒▒▒▒▒▒▒ //

// === BACKTEST RANGE ===
backTestSectionFrom = input(title = "═══════════════ FROM ═══════════════", defval = true, type = input.bool)

FromMonth       = input(defval = 1, title = "Month", minval = 1)
FromDay         = input(defval = 1, title = "Day", minval = 1)
FromYear        = input(defval = 2019, title = "Year", minval = 2014)

backTestSectionTo = input(title = "════════════════ TO ════════════════", defval = true, type = input.bool)
ToMonth         = input(defval = 31, title = "Month", minval = 1)
ToDay           = input(defval = 12, title = "Day", minval = 1)
ToYear          = input(defval = 9999, title = "Year", minval = 2014)

backTestPeriod() => (time > timestamp(FromYear, FromMonth, FromDay, 00, 00)) and (time < timestamp(ToYear, ToMonth, ToDay, 23, 59))

//
// ▒▒▒▒▒▒▒▒▒▒▒▒▒▒▒▒▒▒▒▒▒▒▒▒▒▒▒▒▒▒▒▒▒▒▒▒▒▒▒▒▒▒▒▒▒▒▒▒▒▒▒▒▒▒▒▒▒▒▒▒▒▒▒▒▒▒▒▒▒▒▒▒▒▒▒▒▒▒▒▒▒▒▒▒▒▒▒▒▒▒▒▒▒▒▒▒▒▒▒▒▒▒▒▒▒▒▒▒▒▒▒▒▒▒ //

parameterSection = input(title = "═════════════ STRATEGY ═════════════", defval = true, type = input.bool)
// === INPUT TO SELECT POSITION ===
positionType = input(defval="LONG", title="Position Type", options=["LONG", "SHORT"])

// === INPUT TO SELECT INITIAL STOP LOSS
initialStopLossPercent = input(defval = 3.0, minval = 0.0, title="Initial Stop Loss")

// === INPUT TO SELECT BARS BACK
barsBack = input(title="ATR Period", defval=1)

// === INPUT TO SELECT MULTPLIER FACTOR 
multplierFactor = input(title="ATR multplierFactoriplier", step=0.1, defval=3.0)

//
// ▒▒▒▒▒▒▒▒▒▒▒▒▒▒▒▒▒▒▒▒▒▒▒▒▒▒▒▒▒▒▒▒▒▒▒▒▒▒▒▒▒▒▒▒▒▒▒▒▒▒▒▒▒▒▒▒▒▒▒▒▒▒▒▒▒▒▒▒▒▒▒▒▒▒▒▒▒▒▒▒▒▒▒▒▒▒▒▒▒▒▒▒▒▒▒▒▒▒▒▒▒▒▒▒▒▒▒▒▒▒▒▒▒▒ //

// LOGIC TO FIND DIRECTION WHEN THERE IS TREND CHANGE ACCORDING VOLATILITY
atr = multplierFactor * atr(barsBack)

longStop = hl2 - atr
longStopPrev = nz(longStop[1], longStop)
longStop := close[1] > longStopPrev ? max(longStop, longStopPrev) : longStop

shortStop = hl2 + atr
shortStopPrev = nz(shortStop[1], shortStop)
shortStop := close[1] < shortStopPrev ? min(shortStop, shortStopPrev) : shortStop

direction = 1
direction := nz(direction[1], direction)
direction := direction == -1 and close > shortStopPrev ? 1 : direction == 1 and close < longStopPrev ? -1 : direction

longColor = color.blue
shortColor = color.blue

var valueToPlot = 0.0
var colorToPlot = color.white

if (direction == 1)
    valueToPlot := longStop
    colorToPlot := color.green
else
    valueToPlot := shortStop
    colorToPlot := color.red

//
// ▒▒▒▒▒▒▒▒▒▒▒▒▒▒▒▒▒▒▒▒▒▒▒▒▒▒▒▒▒▒▒▒▒▒▒▒▒▒▒▒▒▒▒▒▒▒▒▒▒▒▒▒▒▒▒▒▒▒▒▒▒▒▒▒▒▒▒▒▒▒▒▒▒▒▒▒▒▒▒▒▒▒▒▒▒▒▒▒▒▒▒▒▒▒▒▒▒▒▒▒▒▒▒▒▒▒▒▒▒▒▒▒▒▒ //
//
// === GLOBAL VARIABLES AND FUNCTIONS TO STORE IMPORTANT CONDITIONALS TO TRAILING STOP
hasEntryLongConditional() => direction == 1
hasCloseLongConditional() => direction == -1

hasEntryShortConditional() => direction == -1
hasCloseShortConditional() => direction == 1

stopLossPercent = positionType == "LONG" ? initialStopLossPercent * -1 : initialStopLossPercent

var entryPrice = 0.0
var updatedEntryPrice = 0.0
var stopLossPrice = 0.0

hasOpenTrade() => strategy.opentrades != 0
notHasOpenTrade() => strategy.opentrades == 0

strategyClose() =>
    if positionType == "LONG"
        strategy.close("LONG", when=true)
    else 
        strategy.close("SHORT", when=true)

strategyOpen() =>
    if positionType == "LONG"
        strategy.entry("LONG", strategy.long, when=true)
    else 
        strategy.entry("SHORT", strategy.short, when=true)

isLong() => positionType == "LONG" ? true : false
isShort() => positionType == "SHORT" ? true : false


//
// ▒▒▒▒▒▒▒▒▒▒▒▒▒▒▒▒▒▒▒▒▒▒▒▒▒▒▒▒▒▒▒▒▒▒▒▒▒▒▒▒▒▒▒▒▒▒▒▒▒▒▒▒▒▒▒▒▒▒▒▒▒▒▒▒▒▒▒▒▒▒▒▒▒▒▒▒▒▒▒▒▒▒▒▒▒▒▒▒▒▒▒▒▒▒▒▒▒▒▒▒▒▒▒▒▒▒▒▒▒▒▒▒▒▒ //
//
// === LOGIC TO TRAILING STOP IN LONG POSITION

if (isLong() and backTestPeriod())

    crossedStopLoss = close <= stopLossPrice
    terminateOperation = hasOpenTrade() and (crossedStopLoss or hasCloseLongConditional())

    if (terminateOperation)
        entryPrice := 0.0
        updatedEntryPrice := entryPrice
        stopLossPrice := 0.0
        strategyClose()
    
    startOperation = notHasOpenTrade() and hasEntryLongConditional()

    if(startOperation)
        entryPrice := close
        updatedEntryPrice := entryPrice
        stopLossPrice := entryPrice + (entryPrice * stopLossPercent) / 100
        strategyOpen()
        
    strategyPercentege = (close - updatedEntryPrice) / updatedEntryPrice * 100.00
    rideUpStopLoss = hasOpenTrade() and strategyPercentege > 1

    if (isLong() and rideUpStopLoss)
        stopLossPercent := stopLossPercent + strategyPercentege - 1.0
        newStopLossPrice = updatedEntryPrice + (updatedEntryPrice * stopLossPercent) / 100  
        stopLossPrice := max(stopLossPrice, newStopLossPrice)
        updatedEntryPrice := stopLossPrice

//
// ▒▒▒▒▒▒▒▒▒▒▒▒▒▒▒▒▒▒▒▒▒▒▒▒▒▒▒▒▒▒▒▒▒▒▒▒▒▒▒▒▒▒▒▒▒▒▒▒▒▒▒▒▒▒▒▒▒▒▒▒▒▒▒▒▒▒▒▒▒▒▒▒▒▒▒▒▒▒▒▒▒▒▒▒▒▒▒▒▒▒▒▒▒▒▒▒▒▒▒▒▒▒▒▒▒▒▒▒▒▒▒▒▒▒ //
//
// === LOGIC TO TRAILING STOP IN SHORT POSITION

if (isShort() and backTestPeriod())

    crossedStopLoss = close >= stopLossPrice
    terminateOperation = hasOpenTrade() and (crossedStopLoss or hasCloseShortConditional())

    if (terminateOperation)
        entryPrice := 0.0
        updatedEntryPrice := entryPrice
        stopLossPrice := 0.0
        strategyClose()
    
    startOperation = notHasOpenTrade() and hasEntryShortConditional()

    if(startOperation)
        entryPrice := close
        updatedEntryPrice := entryPrice
        stopLossPrice := entryPrice + (entryPrice * stopLossPercent) / 100
        strategyOpen()
        
    strategyPercentege = (close - updatedEntryPrice) / updatedEntryPrice * 100.00
    rideDownStopLoss = hasOpenTrade() and strategyPercentege < -1

    if (rideDownStopLoss)
        stopLossPercent := stopLossPercent + strategyPercentege + 1.0
        newStopLossPrice = updatedEntryPrice + (updatedEntryPrice * stopLossPercent) / 100  
        stopLossPrice := min(stopLossPrice, newStopLossPrice)
        updatedEntryPrice := stopLossPrice

//
// ▒▒▒▒▒▒▒▒▒▒▒▒▒▒▒▒▒▒▒▒▒▒▒▒▒▒▒▒▒▒▒▒▒▒▒▒▒▒▒▒▒▒▒▒▒▒▒▒▒▒▒▒▒▒▒▒▒▒▒▒▒▒▒▒▒▒▒▒▒▒▒▒▒▒▒▒▒▒▒▒▒▒▒▒▒▒▒▒▒▒▒▒▒▒▒▒▒▒▒▒▒▒▒▒▒▒▒▒▒▒▒▒▒▒ 
//
// === DRAWING SHAPES     

entryPricePlotConditinal = entryPrice == 0.0 ? na : entryPrice
trailingStopLossPlotConditional = stopLossPrice == 0.0  ? na : stopLossPrice

plotshape(entryPricePlotConditinal, title= "Entry Price", color=color.blue, style=shape.circle, location=location.absolute, size=size.tiny)
plotshape(trailingStopLossPlotConditional, title= "Stop Loss", color=color.red, style=shape.circle, location=location.absolute, size=size.tiny)

plot(valueToPlot == 0.0 ? na : valueToPlot, title="BuyLine", linewidth=2, color=colorToPlot)
plotshape(direction == 1 and direction[1] == -1 ? longStop : na, title="Buy", style=shape.labelup, location=location.absolute, size=size.normal, text="Buy", transp=0, textcolor = color.white, color=color.green, transp=0)
plotshape(direction == -1 and direction[1] == 1 ? shortStop : na, title="Sell", style=shape.labeldown, location=location.absolute, size=size.normal, text="Sell", transp=0, textcolor = color.white, color=color.red, transp=0)

alertcondition(direction == 1 and direction[1] == -1 ? longStop : na, title="Buy", message="Buy!")
alertcondition(direction == -1 and direction[1] == 1 ? shortStop : na, title="Sell", message="Sell!")