Trailing-Stop-Loss-Strategie mit doppeltem gleitenden Durchschnitt
Überblick
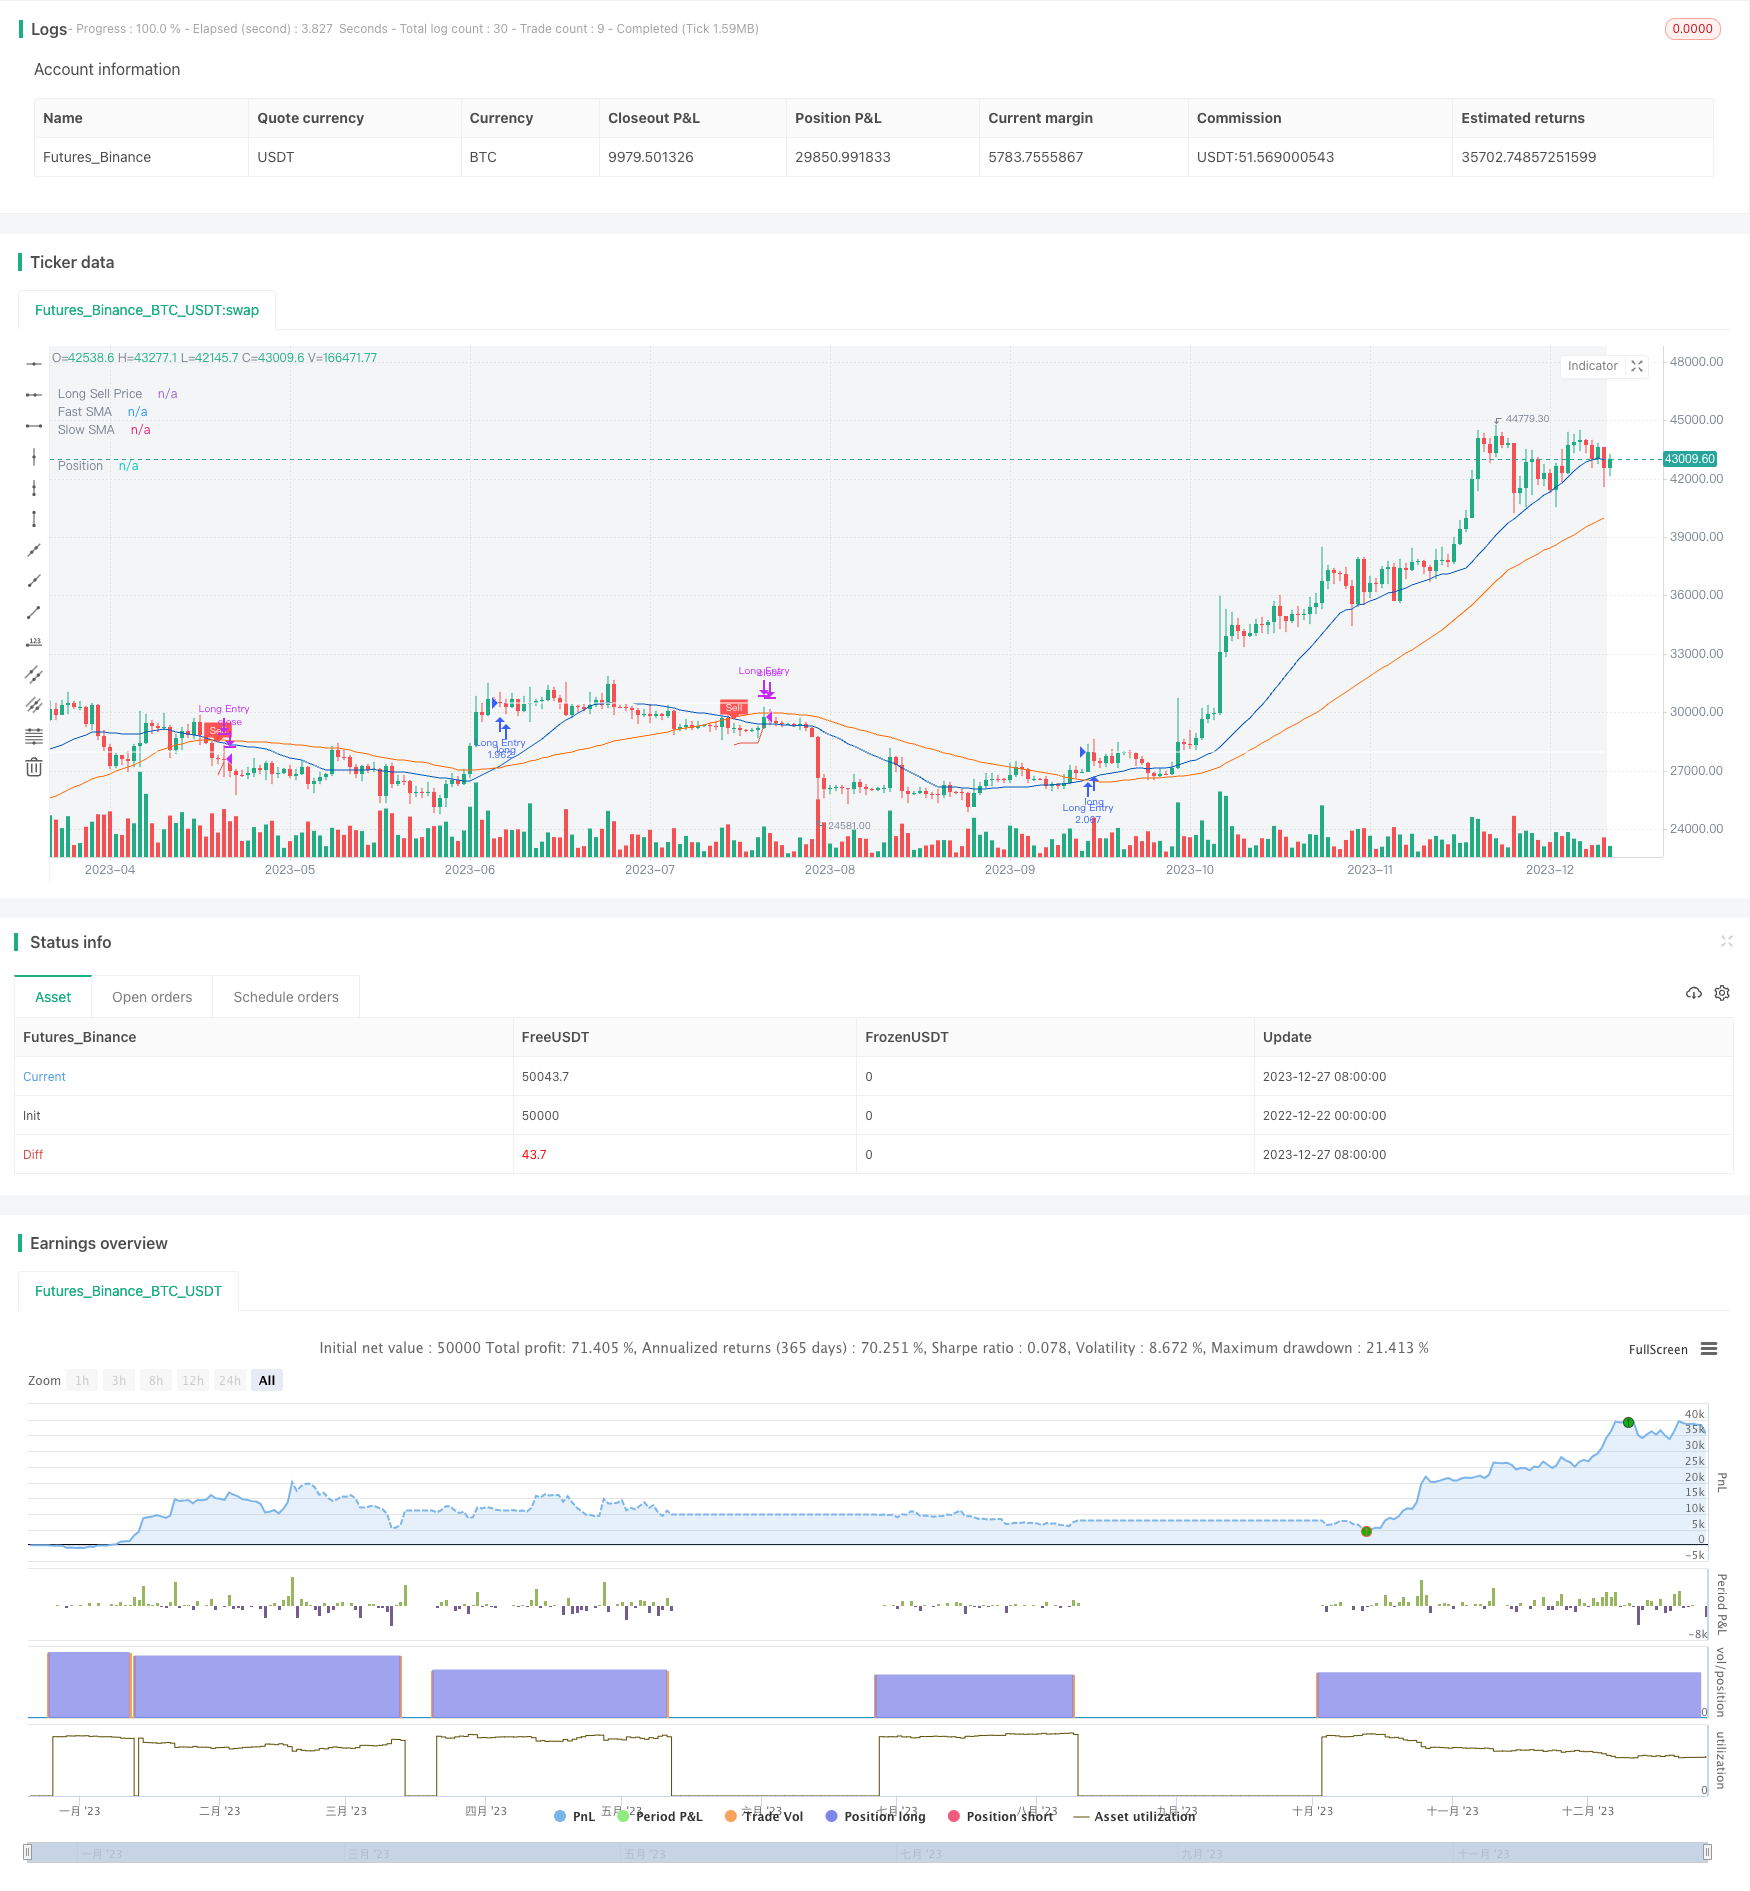
Die Strategie basiert auf der Kreuzung von schnellen Durchschnitts- und langsamen Durchschnittslinien, um zu entscheiden, ob mehr Short-Positions gemacht werden. Wenn die schnellen Durchschnittslinien über die langsamen Durchschnittslinien durchbrechen, werden mehr Geschäfte gemacht, wenn die schnellen Durchschnittslinien unter die langsamen Durchschnittslinien durchbrechen. Um höhere Gewinne zu erzielen, verwendet die Strategie einen Stop-Loss-Mechanismus.
Strategieprinzip
Die Strategie nutzt die schnellen einfachen gleitenden Mittel (SMA) und die langsamen SMA, um zu entscheiden, wie viel und wann man eine Pause macht. Wenn der schnelle SMA den langsamen SMA durchschreitet, beurteilt man den Trend als aufwärts, und dann macht man mehr; wenn der schnelle SMA den langsamen SMA durchschreitet, beurteilt man den Trend als umgekehrt und bereitet sich auf eine Pause vor.
Um höhere Gewinne zu erzielen, wurde ein Tracking-Stop-Mechanismus eingeführt. Anstatt eine Stop-Loss-Anweisung zu einem festen Preis zu setzen, wurde ein Tracking-Stop-Preis eingerichtet, der mit steigenden Preisen nach oben verfolgt wird. Jedes Mal, wenn der Preis um einen bestimmten Prozentsatz steigt, wird der Tracking-Stop-Preis um einen bestimmten Betrag nach oben angepasst.
Die Berechnungsformel für die Verfolgung von Stop-Loss-Preisen lautet:
Verfolgung des Stop-Loss-Preises = Preis × (1 - Verfolgung des Stop-Loss-Prozentsatz)
Der Stop-Loss-Tracking-Prozentsatz wird durch die Strategie-Parameter-Ebene Deviation % festgelegt. Die Strategie berechnet bei jedem K-Linien-Abschluss nach dem Positionseröffnen einen neuen Tracking-Stop-Loss-Preis. Der neue Tracking-Stop-Loss-Preis darf nicht niedriger sein als der Tracking-Stop-Loss-Preis der vorherigen K-Line, um sicherzustellen, dass der Stop-Loss-Preis nur nach oben bewegt und nicht zurückgeht.
Wenn der Preis fällt und den Tracking-Stop-Loss-Preis erreicht, wird ein Ausgleichssignal ausgelöst, und die Position wird mit einem Marktpreis-Einfach-Ausgleichs-Position eingesetzt.
Strategische Vorteile
- Die Trendrichtung wird mit einer doppelten Gleichheitslinie beurteilt, die besser zurückmessbar ist.
- Die Einführung von Stop-Loss-Tracking ermöglicht eine höhere Gewinnquote.
- Benutzerdefinierte Durchschnittszyklus und Stop-Loss-Tracking
- Die Stop-Loss-Linie bewegt sich im Aufwärtstrend kontinuierlich nach oben und sichert den Großteil der Gewinne.
- Wenn sich der Trend umkehrt, können Sie schnell aufhören und größere Verluste vermeiden.
Risiken und Lösungen
- Die falsche Wahl des Zeitpunkts für die Durchmesserüberschreitung kann zu einem virtuellen Signal führen. Verschiedene Parameter können getestet werden, um die optimale Durchmesserkombination zu finden
- Die Verfolgung von Stop Loss ist zu radikal und kann dazu führen, dass die Stop Loss zu früh durchbrochen wird. Die Parameter für die Verfolgung von Stop Loss Prozentsatz können entsprechend angepasst werden.
- Es kann auch sein, dass die Stop-Loss-Preise direkt überschritten werden. Es wird empfohlen, andere Indikatoren zu kombinieren, um Trends zu beurteilen und den Handel in schwankenden Situationen zu vermeiden.
Optimierungsrichtung
- Verschiedene Parameter der Gleichlaufzeit können getestet werden, um die optimale Kombination zu finden
- Verschiedene Stop-Loss-Tracking-Prozentsatzparameter können getestet werden, um die optimale Stop-Loss-Ebene zu finden
- Es ist möglich, andere Indikatoren zu nutzen, um zu entscheiden, ob der Handel in einer bewegten Situation ausgesetzt ist, um die Auswirkungen von Ereignissen zu vermeiden.
Zusammenfassen
Diese Strategie kombiniert die Verwendung von Gleichgewichtsindikatoren, um die Trendrichtung zu bestimmen, und die Verfolgung von Stop-Loss-Mechanismen, um Gewinne zu lockern. Sie ist in den Trainingsdaten gut. Durch die Optimierung der Parameterkombination, die Risikokontrolle, ist es möglich, stabile Erträge zu erzielen.
/*backtest
start: 2022-12-22 00:00:00
end: 2023-12-28 00:00:00
period: 1d
basePeriod: 1h
exchanges: [{"eid":"Futures_Binance","currency":"BTC_USDT"}]
*/

//@version=5
//
// ▒▒▒▒▒▒▒▒▒▒▒▒▒▒▒▒▒▒▒▒▒▒▒▒▒▒▒▒▒▒▒▒▒▒▒▒▒▒▒▒▒▒▒▒▒▒▒▒▒▒▒▒▒▒▒▒▒▒▒▒▒▒▒▒▒▒▒▒▒▒▒▒▒▒▒▒▒▒▒▒▒▒▒▒▒▒▒▒▒▒▒▒▒▒▒▒▒▒▒▒▒▒▒▒▒▒▒▒▒▒▒▒▒▒
//  -----------------------------------------------------------------------------
//  Copyright 2022 Iason Nikolas | jason5480
//  Trailing Buy script may be freely distributed under the MIT license.
//
//  Permission is hereby granted, free of charge,
//  to any person obtaining a copy of this software and associated documentation files (the "Software"),
//  to deal in the Software without restriction, including without limitation the rights to use, copy, modify, merge,
//  publish, distribute, sublicense, and/or sell copies of the Software, and to permit persons to whom the Software is furnished to do so,
//  subject to the following conditions:
//
//  The above copyright notice and this permission notice shall be included in all copies or substantial portions of the Software.
//
//  THE SOFTWARE IS PROVIDED "AS IS", WITHOUT WARRANTY OF ANY KIND,
//  EXPRESS OR IMPLIED, INCLUDING BUT NOT LIMITED TO THE WARRANTIES OF MERCHANTABILITY,
//  FITNESS FOR A PARTICULAR PURPOSE AND NONINFRINGEMENT. IN NO EVENT SHALL THE AUTHORS OR COPYRIGHT HOLDERS BE LIABLE FOR ANY CLAIM,
//  DAMAGES OR OTHER LIABILITY, WHETHER IN AN ACTION OF CONTRACT, TORT OR OTHERWISE, ARISING FROM,
//  OUT OF OR IN CONNECTION WITH THE SOFTWARE OR THE USE OR OTHER DEALINGS IN THE SOFTWARE.
//
//  -----------------------------------------------------------------------------
//
//  Authors:  @jason5480
//  Revision: v1.0.1
//  Date:     24-Feb-2022
//
//  Description
//  =============================================================================
//  This strategy will go long if fast MA crosses over slow MA.
//  If the 'Enable Trailing` is checked then the strategy instead of exiting from the position
//  directly it will follow the price upwards (percentagewise) with small steps
//  If the price drops by this percentage then the exit order will be executed
//
//  The strategy has the following parameters:
//
//  Fast SMA Length - How many candles back to calculte the fast SMA.
//  Slow SMA Length - How many candles back to calculte the slow SMA.
//  Enable Trailing - Enable or disable the trailing
//  Deviation % - The step to follow the price when the open position condition is met.
//  Source Exit Control - The source price to compare with the exit price to trigger the exit order when trailing.
//
//  -----------------------------------------------------------------------------
//  Disclaimer:
//    1. I am not licensed financial advisors or broker dealer. I do not tell you
//       when or what to buy or sell. I developed this software which enables you
//       execute manual or automated using TradingView. The
//       software allows you to set the criteria you want for entering and exiting
//       trades.
//    2. Do not trade with money you cannot afford to lose.
//    3. I do not guarantee consistent profits or that anyone can make money with no
//       effort. And I am not selling the holy grail.
//    4. Every system can have winning and losing streaks.
//    5. Money management plays a large role in the results of your trading. For
//       example: lot size, account size, broker leverage, and broker margin call
//       rules all have an effect on results. Also, your Take Profit and Stop Loss
//       settings for individual pair trades and for overall account equity have a
//       major impact on results. If you are new to trading and do not understand
//       these items, then I recommend you seek education materials to further your
//       knowledge.
//
//    YOU NEED TO FIND AND USE THE TRADING SYSTEM THAT WORKS BEST FOR YOU AND YOUR
//    TRADING TOLERANCE.
//
//    I HAVE PROVIDED NOTHING MORE THAN A TOOL WITH OPTIONS FOR YOU TO TRADE WITH THIS PROGRAM ON TRADINGVIEW.
//
//    I accept suggestions to improve the script.
//    If you encounter any problems I will be happy to share with me.
//  -----------------------------------------------------------------------------
//
// ▒▒▒▒▒▒▒▒▒▒▒▒▒▒▒▒▒▒▒▒▒▒▒▒▒▒▒▒▒▒▒▒▒▒▒▒▒▒▒▒▒▒▒▒▒▒▒▒▒▒▒▒▒▒▒▒▒▒▒▒▒▒▒▒▒▒▒▒▒▒▒▒▒▒▒▒▒▒▒▒▒▒▒▒▒▒▒▒▒▒▒▒▒▒▒▒▒▒▒▒▒▒▒▒▒▒▒▒▒▒▒▒▒▒
// SETUP ============================================================================================================

strategy(title = 'Trailing Sell',
         shorttitle = 'TS',
         overlay = true,
         pyramiding = 0,
         default_qty_type = strategy.percent_of_equity,
         default_qty_value = 100,
         initial_capital = 100000)

//
// ▒▒▒▒▒▒▒▒▒▒▒▒▒▒▒▒▒▒▒▒▒▒▒▒▒▒▒▒▒▒▒▒▒▒▒▒▒▒▒▒▒▒▒▒▒▒▒▒▒▒▒▒▒▒▒▒▒▒▒▒▒▒▒▒▒▒▒▒▒▒▒▒▒▒▒▒▒▒▒▒▒▒▒▒▒▒▒▒▒▒▒▒▒▒▒▒▒▒▒▒▒▒▒▒▒▒▒▒▒▒▒▒▒▒
// FILTERS ==========================================================================================================

// INPUT ============================================================================================================
usefromDate = input.bool(defval = true, title = 'From', inline = "From Date", group = "Filters")
fromDate = input(defval = timestamp('01 Jan 2021 00:00 UTC'), title = '', inline = "From Date", group = 'Filters')
usetoDate = input.bool(defval = false, title = 'To ', inline = "To Date", group = "Filters")
toDate = input(defval = timestamp('31 Dec 2121 23:59 UTC'), title = '', inline = "To Date", group = 'Filters')

// LOGIC ============================================================================================================
isWithinPeriod() => true // create function "within window of time"

// PLOT =============================================================================================================
bgcolor(color = isWithinPeriod() ? color.new(color.gray, 90) : na, title = 'Period')

//
// ▒▒▒▒▒▒▒▒▒▒▒▒▒▒▒▒▒▒▒▒▒▒▒▒▒▒▒▒▒▒▒▒▒▒▒▒▒▒▒▒▒▒▒▒▒▒▒▒▒▒▒▒▒▒▒▒▒▒▒▒▒▒▒▒▒▒▒▒▒▒▒▒▒▒▒▒▒▒▒▒▒▒▒▒▒▒▒▒▒▒▒▒▒▒▒▒▒▒▒▒▒▒▒▒▒▒▒▒▒▒▒▒▒▒
// STRATEGY =========================================================================================================

// INPUT ============================================================================================================
fastMALen = input.int(defval = 21, title = 'Fast/Slow SMA Length', inline = 'MA Length', group = 'Strategy')
slowMALen = input.int(defval = 49, title = '', tooltip = 'How many candles back to calculte the fast/slow SMA.', inline = 'MA Length', group = 'Strategy')

// LOGIC ============================================================================================================
fastMA = ta.sma(close, fastMALen)
slowMA = ta.sma(close, slowMALen)

bool openLongPosition = isWithinPeriod() and ta.crossover(fastMA, slowMA)
bool closeLongPosition = ta.crossunder(fastMA, slowMA)

// PLOT =============================================================================================================
var fastColor = color.new(#0056BD, 0)
plot(series = fastMA, title = 'Fast SMA', color = fastColor, linewidth = 1, style = plot.style_line)
var slowColor = color.new(#FF6A00, 0)
plot(series = slowMA, title = 'Slow SMA', color = slowColor, linewidth = 1, style = plot.style_line)

plotshape(series = closeLongPosition and strategy.position_size > 0 ? fastMA : na, title = 'Sell', text = 'Sell', style = shape.labeldown, location = location.absolute, color = color.new(color.red, 0), textcolor = color.new(color.white, 0), size = size.tiny)

//
// ▒▒▒▒▒▒▒▒▒▒▒▒▒▒▒▒▒▒▒▒▒▒▒▒▒▒▒▒▒▒▒▒▒▒▒▒▒▒▒▒▒▒▒▒▒▒▒▒▒▒▒▒▒▒▒▒▒▒▒▒▒▒▒▒▒▒▒▒▒▒▒▒▒▒▒▒▒▒▒▒▒▒▒▒▒▒▒▒▒▒▒▒▒▒▒▒▒▒▒▒▒▒▒▒▒▒▒▒▒▒▒▒▒▒
// EXIT ============================================================================================================

// INPUT ============================================================================================================
enableTrailing = input.bool(defval = true, title = 'Enable Trailing', tooltip = 'Enable or disable the trailing for exit position.', group = 'Exit')
devExitPerc = input.float(defval = 3.0, title = 'Deviation %', minval = 0.01, maxval = 100, step = 0.05, tooltip = 'The step to follow the price when the open position condition is met.', group = 'Exit') / 100
ctrLongExitSrc = input.source(defval = low, title = 'Source Exit Control', tooltip = 'The source price to compare with the exit price to trigger the exit order when trailing.', group = 'Exit')

// LOGIC ============================================================================================================
var bool exitLongPosition = false

int barsSinceOpenLong = nz(ta.barssince(openLongPosition), 999999)
int barsSinceCloseLong = nz(ta.barssince(closeLongPosition), 999999)
int barsSinceExitLong = nz(ta.barssince(exitLongPosition), 999999)
bool closeLongIsActive = barsSinceOpenLong >= barsSinceCloseLong
bool exitLongIsPending = barsSinceExitLong >= barsSinceCloseLong
bool tryExitLongPosition = isWithinPeriod() and closeLongIsActive and exitLongIsPending

float longExitPrice = na
longExitPrice := if closeLongPosition and strategy.position_size > 0
    close * (1 - devExitPerc)
else if tryExitLongPosition
    math.max(high * (1 - devExitPerc), nz(longExitPrice[1], 999999))
else
    na

exitLongPosition := enableTrailing ? isWithinPeriod() and ta.crossunder(closeLongPosition ? close : ctrLongExitSrc, longExitPrice) : closeLongPosition

// PLOT =============================================================================================================
var sellPriceColor = color.new(#e25141, 0)
plot(series = enableTrailing ? longExitPrice : na, title = 'Long Sell Price', color = sellPriceColor, linewidth = 1, style = plot.style_linebr)

//
// ▒▒▒▒▒▒▒▒▒▒▒▒▒▒▒▒▒▒▒▒▒▒▒▒▒▒▒▒▒▒▒▒▒▒▒▒▒▒▒▒▒▒▒▒▒▒▒▒▒▒▒▒▒▒▒▒▒▒▒▒▒▒▒▒▒▒▒▒▒▒▒▒▒▒▒▒▒▒▒▒▒▒▒▒▒▒▒▒▒▒▒▒▒▒▒▒▒▒▒▒▒▒▒▒▒▒▒▒▒▒▒▒▒▒
// POSITION ORDERS ==================================================================================================

// LOGIC ============================================================================================================
// getting into LONG position
strategy.entry(id = 'Long Entry', direction = strategy.long, when = openLongPosition, alert_message = 'Long(' + syminfo.ticker + '): Started')
// submit close order on trend reversal
strategy.close(id = 'Long Entry', when = exitLongPosition, comment = 'Close Long', alert_message = 'Long(' + syminfo.ticker + '): Closed at market price')

// PLOT =============================================================================================================
var posColor = color.new(color.white, 0)
plot(series = strategy.position_avg_price, title = 'Position', color = posColor, linewidth = 1, style = plot.style_linebr)

// ==================================================================================================================