Mehrperioden-MACD-Indikator-Handelsstrategie
Überblick
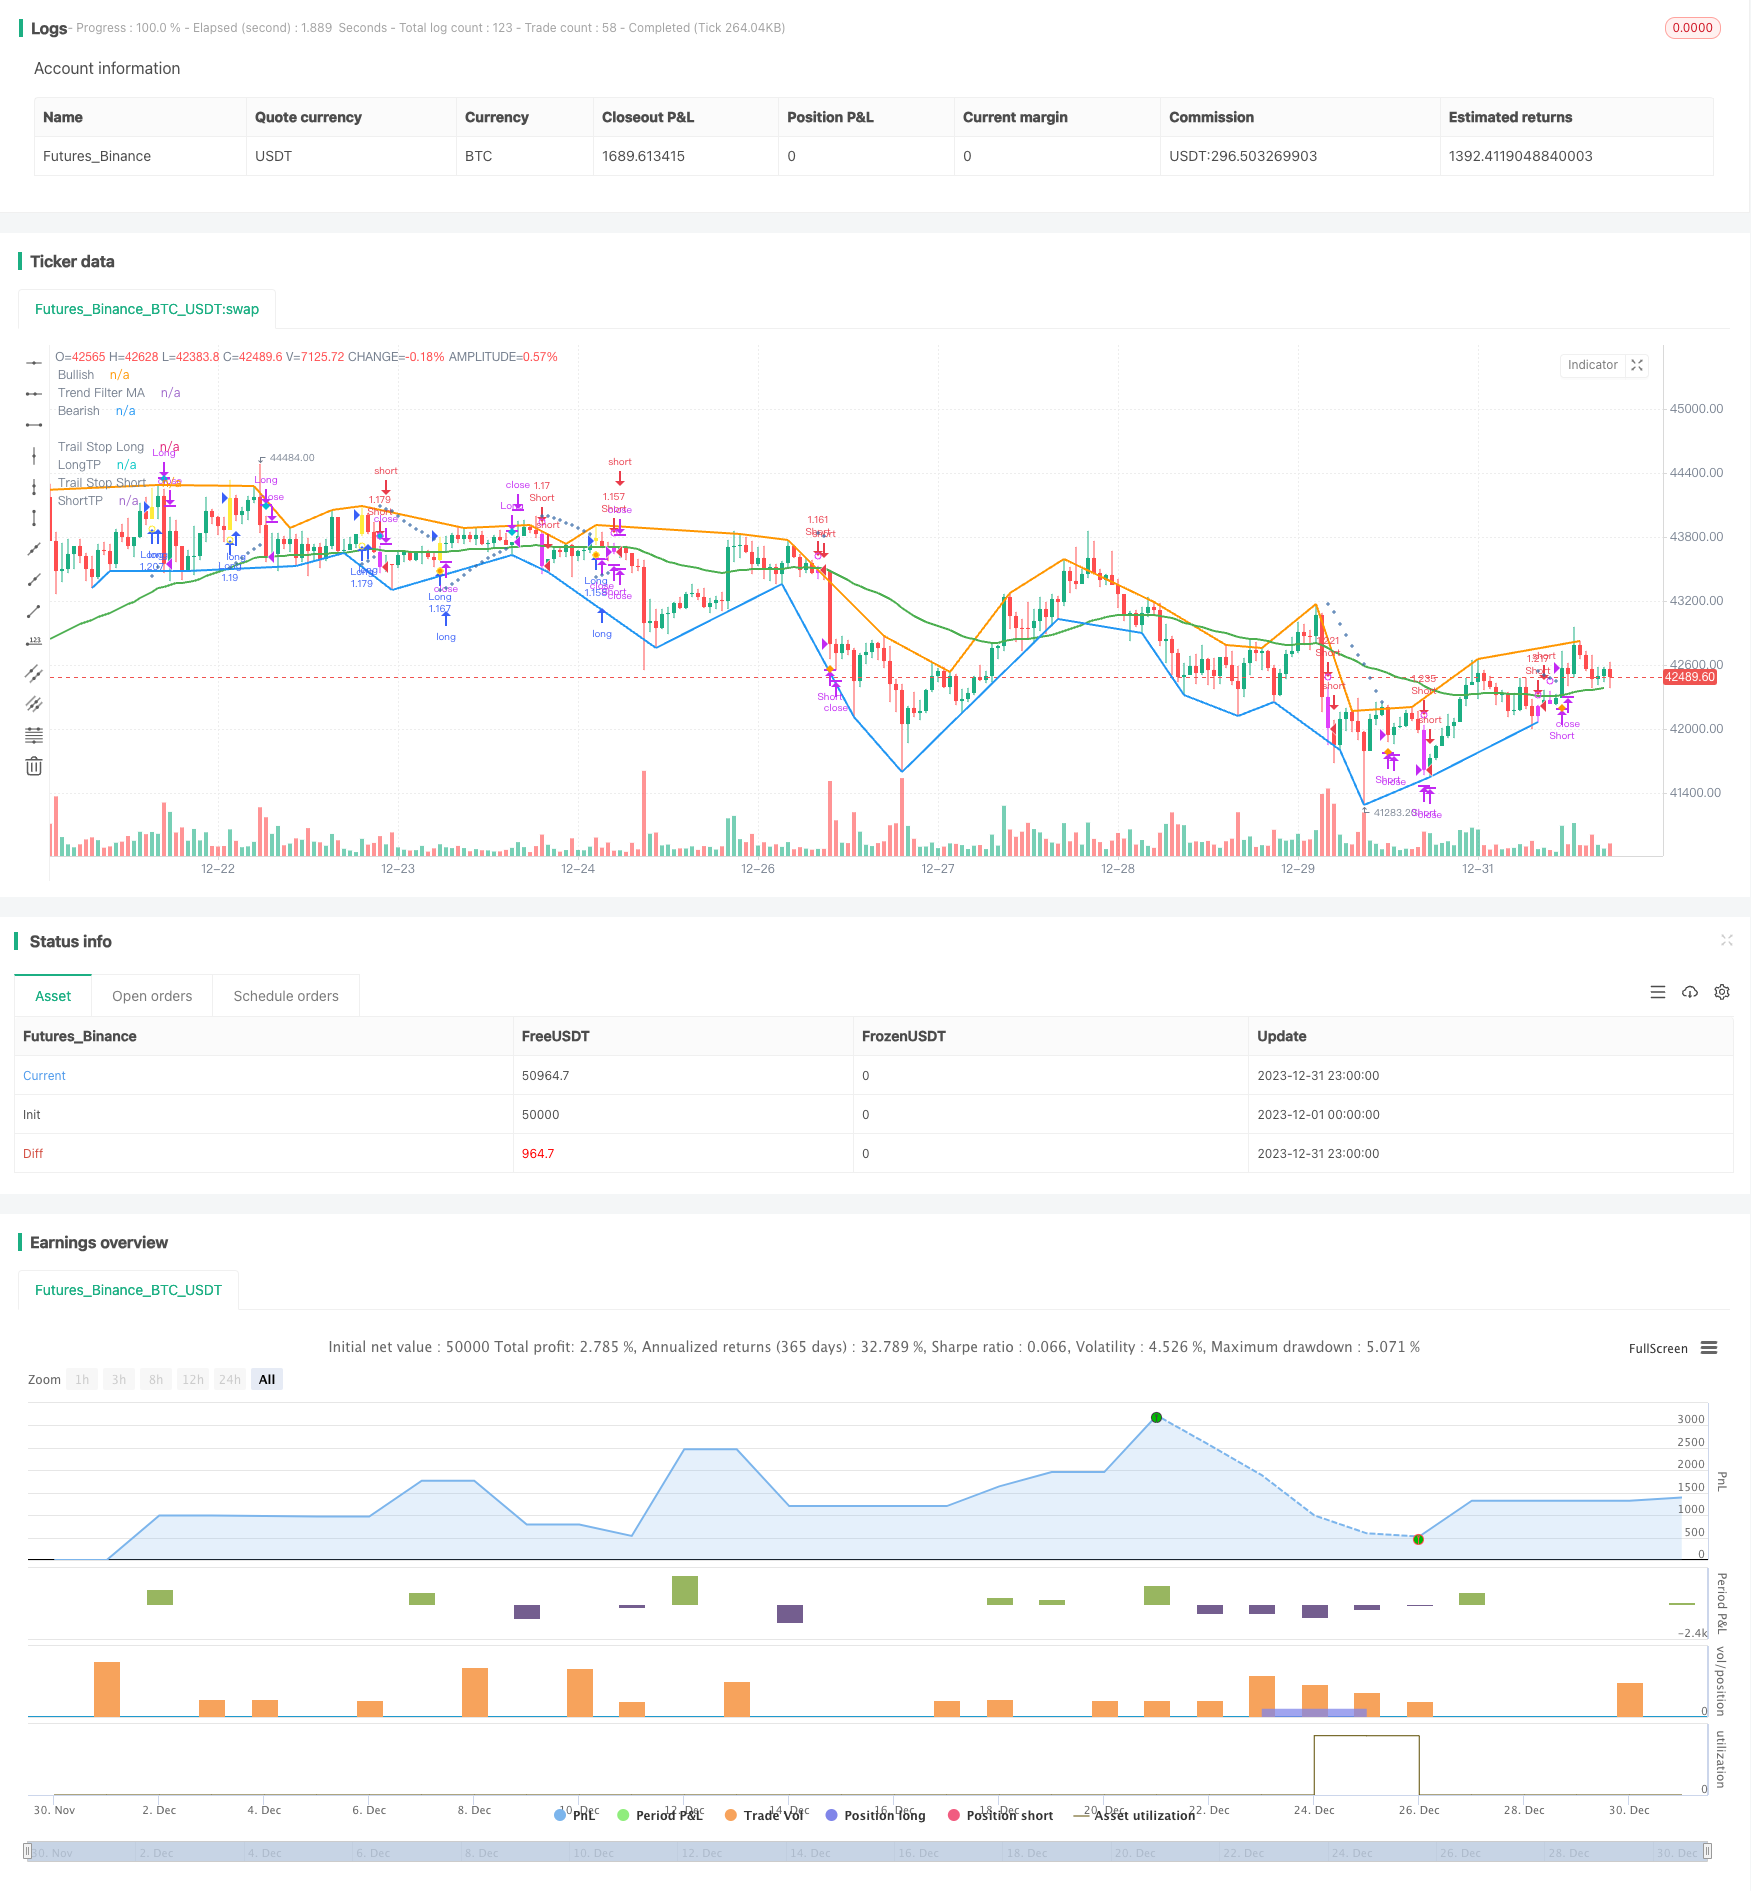
Diese Strategie basiert auf dem klassischen MACD-Indikator und kombiniert mehrere Hilfsmittel wie Trend-Beschlüsse, Stop-Loss-Methoden und Stop-Stop-Methoden zu einer relativ vollständigen Trend-Tracking-Handelsstrategie. Sie kann sowohl für digitale Währungen als auch für Devisen- und Aktienhandel verwendet werden.
Strategieprinzip
MACD-Indikator-Beschlüsse
- Die Differenz zwischen FASTLENGTH-EMA und SLOWLENGTH-EMA bildet die MACD-Säule
- MACDLENGTH-Periode EMA Glatte MACD-Säulen bilden MACD-Linien
- Die MACD-Säule durchbricht die Null-Achse und bildet ein Kauf- und Verkaufssignal.
Trends beurteilen
- ADX: Durchschnittlicher Trendindikator, um zu beurteilen, ob ein Trend vorliegt
- MA: Moving Average, bei dem sich die Preise über und unter der MA bewegen
- SAR: Parabolische SAR, SAR bewegt sich nach oben oder unten
Verlustbewältigung
- ATR-Prozentsatz-Stopp: Prozentsatz-Stopp basierend auf dem ATR-Faktor
- SAR-Stopp: Parallax-Linie als nachträglicher Stopp
Wie man das aufhält
- ATR-Feststoppdistanz: Einstellung der Feststoppdistanz nach dem ATR-Faktor
- Prozentsatz-Stop: Setzen Sie den Prozentsatz-Stop-Abstand
Zeitverschwendung
- Setzbar nach einer bestimmten Anzahl von Artikeln
Analyse der Stärken
Mehrere Nebenurteile
- Zusammen mit Trends unterstützt Resistenzbeurteilung falsche Signale
- ATR/SAR-Stillstand und umfassendere Risikokontrolle
Flexible Konfiguration
- Trends können ausgewählt werden
- Optionale ATR- oder SAR-Stopp
- Optionale ATR- oder Standardstopper
- Die Parameter sind flexibel konfigurierbar
Bereitstellung von Feedbackanalyse
- Die Geschichte ist positiv und negativ.
- Text-Hinweise bereitstellen
Optimierung der Anpassung
- Die Strategie enthält viele konfigurierbare Parameter
- Tests mit unterschiedlichen Variablenkombinationen
Risikoanalyse
Fehlende Parameter können zu größeren Verlusten führen
- ATR/SAR-Parameter sind falsch eingestellt und könnten zu früh ausfallen
- Das Stopp-Verhältnis ist zu hoch eingestellt und könnte zu früh eingestellt werden
Risiko von Fehlentscheidungen bei Trends
- Die falschen Parameter des Trendindikators können zu Fehleinschätzungen führen.
- Trends werden durch unvorhergesehene Ereignisse nicht beurteilt.
Zeitverschiebungsrisiken
- Das Setzen eines festen Stop-Loss-Zeitpunkts ist mit einem Verlustrisiko verbunden.
Optimierungsrichtung
- Anpassung der ATR- und SAR-Parameter, um den Verlust zu erleichtern
- Verschiedene MA-Zyklen zu testen und Trends zu optimieren
- Tests zur Anpassung der Stoppquote und Optimierung der Rendite
- Optimierungsparameter in Kombination mit der Schwankungsrate
Zusammenfassen
Diese Strategie-Synthese berücksichtigt mehrere Aspekte wie Trendbeurteilung, Stop-Loss-Stopp-Stopp und Rückschalt-Erkennung, um eine relativ umfassende Digitalwährungshandelsstrategie zu bilden. Sie kombiniert die Vorteile des MACD-Indikators, erhöht die Trendfilterung und vermeidet Fehlgeschäfte; erhöht den ATR / SAR-Stopp, um das Risiko besser zu kontrollieren; Rückschalt-Erkennung bietet zusätzliche Referenzen. Eine Vielzahl von konfigurierbaren Parametern, die leicht getestet und optimiert werden können.
/*backtest
start: 2023-12-01 00:00:00
end: 2023-12-31 23:59:59
period: 1h
basePeriod: 15m
exchanges: [{"eid":"Futures_Binance","currency":"BTC_USDT"}]
*/

// This source code is subject to the terms of the Mozilla Public License 2.0 at https://mozilla.org/MPL/2.0/
// © systemalphatrader

//@version=4

strategy(title="MACD+ Strategy [SystemAlpha]", shorttitle="MACD+ Strategy [SA]", overlay=true, initial_capital=10000, currency='USD',
   default_qty_type=strategy.percent_of_equity, default_qty_value=100, commission_type=strategy.commission.percent, commission_value=0.04)

// == MAIN INPUT ==
// TREND FILTER
// Make input option to configure trend filter
trendFilter  = input(title="Trend Filter", defval='MA', options=['ADX', 'MA', 'SAR', 'All', 'None'])

// Translate input into trend filters
useADXFilter    = (trendFilter == 'ADX') or (trendFilter == 'All')
useSARFilter    = (trendFilter == 'SAR') or (trendFilter == 'All')
useMAFilter     = (trendFilter == 'MA') or (trendFilter == 'All')

// TRAIL STOP
// Make input option to configure trail stop
trailStop       = input(title="Trailing Stop Loss", defval='SAR', options=['ATR', 'SAR', 'None'])

// Translate input
useATRStop      = (trailStop == 'ATR')
useSARStop      = (trailStop == 'SAR')

// TAKE PROFIT TARGET
// Make input option to configure trail stop
TPtarget       = input(title="Take Profit Type", defval='ATR', options=['ATR', 'Percent', 'None'])

// Translate input
useATRTP        = (TPtarget == 'ATR')
usePercentTP    = (TPtarget == 'Percent')

// ALERTS and BAR COLOR
// Make input option to configure alerts
alerts          = input(title="Select Alerts to Display", defval='None', options=['Buy/Sell', 'Exit', 'Both', 'None'])

// Translate input
showsignals     = (alerts == 'Buy/Sell') or (alerts == 'Both')
showexitsignals = (alerts == 'Exit') or (alerts == 'Both')
showBarColor    = input(true, title="Show Bar Color")

// == /MAIN INPUT  ==

/////////////////////////////////////
//*STRATEGY LOGIC                 *//
/////////////////////////////////////

// == MACD ==
fastLength = input(12, title="Fast Length")
slowlength = input(26, title="Slow Length")
MACDLength = input(9, title="MACD Length")

MACD = ema(close, fastLength) - ema(close, slowlength)
aMACD = ema(MACD, MACDLength)
delta = MACD - aMACD

// Calc breakouts
break_up        = crossover(delta, 0)
break_down      = crossunder(delta,0)
// == /MACD ==

// == DIVERGENCE ==
method      = input(title="Divergence Method", defval='Hist', options=['Hist', 'MACD'])
divtype     = input(title="Divergence Type", defval='None', options=['Regular', 'Hidden', 'Both', 'None'])
uReg        = divtype == 'Regular' or divtype == 'Both'
uHid        = divtype == 'Hidden' or divtype == 'Both'
showlabel   = input(true, title="Show Divergence Label")
v_show_last = input(500, "Plotting Lookback Bars Length")

high_src = high
low_src  = low

//  ||  Functions:
f_top_fractal(_src) =>
    _src[4] < _src[2] and _src[3] < _src[2] and _src[2] > _src[1] and
       _src[2] > _src[0]
f_bot_fractal(_src) =>
    _src[4] > _src[2] and _src[3] > _src[2] and _src[2] < _src[1] and
       _src[2] < _src[0]
f_fractalize(_src) =>
    f_bot_fractal__1 = f_bot_fractal(_src)
    f_top_fractal(_src) ? 1 : f_bot_fractal__1 ? -1 : 0
// === End of Functions

//  ||  Method selection
oscilator_high = float(na)
oscilator_low = float(na)
if method == 'MACD'
    oscilator_high := MACD
    oscilator_low := MACD
if method == 'Hist'
    oscilator_high := delta
    oscilator_low := delta
//
fractal_top = f_fractalize(oscilator_high) > 0 ? oscilator_high[2] : na
fractal_bot = f_fractalize(oscilator_low) < 0 ? oscilator_low[2] : na

high_prev   = valuewhen(fractal_top, oscilator_high[2], 0)[2]
high_price  = valuewhen(fractal_top, high[2], 0)[2]
low_prev    = valuewhen(fractal_bot, oscilator_low[2], 0)[2]
low_price   = valuewhen(fractal_bot, low[2], 0)[2]

regular_bearish_div = fractal_top and high[2] > high_price and oscilator_high[2] < high_prev
hidden_bearish_div  = fractal_top and high[2] < high_price and oscilator_high[2] > high_prev
regular_bullish_div = fractal_bot and low[2] < low_price and oscilator_low[2] > low_prev
hidden_bullish_div  = fractal_bot and low[2] > low_price and oscilator_low[2] < low_prev

// Plotting
plot(title='Bullish', series=fractal_top ? high[2] : na, color = regular_bearish_div and uReg or hidden_bearish_div and uHid ? color.red : na, linewidth = 2, transp=50, offset=-2, show_last = v_show_last)
plot(title='Bearish', series=fractal_bot ? low[2] : na, color = regular_bullish_div and uReg or hidden_bullish_div and uHid ? color.green : na, linewidth = 2, transp=50, offset=-2, show_last = v_show_last)

plotshape(title='Regular Bearish', series=not showlabel or not uReg ? na : regular_bearish_div ? high[2] : na, text='R', style=shape.labeldown, location=location.absolute, color=color.red, textcolor=color.white, transp=50, offset=-2, show_last = v_show_last)
plotshape(title='Hidden Bearish', series=not showlabel or not uHid ? na : hidden_bearish_div ? high[2] : na, text='H', style=shape.labeldown, location=location.absolute, color=color.red, textcolor=color.white, transp=80, offset=-2, show_last = v_show_last)
plotshape(title='Regular Bullish', series=not showlabel or not uReg ? na : regular_bullish_div ? low[2] : na, text='R', style=shape.labelup, location=location.absolute, color=color.green, textcolor=color.white, transp=50, offset=-2, show_last = v_show_last)
plotshape(title='Hidden Bullish', series=not showlabel or not uHid ? na : hidden_bullish_div ? low[2] : na, text='H', style=shape.labelup, location=location.absolute, color=color.green, textcolor=color.white, transp=80, offset=-2, show_last = v_show_last)

// == /DIVERGENCE ==

// == ENTRY ==
// == ADX FILTERING ==
// Look at ADX when it is above a user-defined key level (23 default) and this is to identify when it is trending.
// It then looks at the DMI levels.  If D+ is above D- and the ADX is sloping upwards and above the key level, it triggers a buy condition.  Opposite for short.
adxlen          = 13 //input(13, title="TF ADX Smoothing")
dilen           = 13 //input(13, title="TF DI Period")
keyLevel        = 23 //input(23, title="TF Keylevel for ADX")

// == USE BUILT-IN DMI FUNCTION TO DETERMINE ADX AND BULL/BEAR STRENGTH
[diplus, diminus, adx] = dmi(dilen, adxlen)

//Buy and Sell Filter
ADXBuyCheck     = useADXFilter? diplus > diminus : true
ADXSellCheck    = useADXFilter? diplus < diminus : true
// == /ADX FILTERING ==

// == MOVING AVERAGE FILTERING ==
// MA FILTER: Use a user-defined moving average to filter long/short if desried.
maType          = input(defval="EMA", options=["EMA", "SMA"], title = "TF MA Type")
maLength        = input(defval = 50, title = "TF MA Period", minval = 1)

// Declare function to be able to swap out EMA/SMA
ma(maType, src, length) =>
    maType == "EMA" ? ema(src, length) : sma(src, length)
maFilter        = ma(maType, close, maLength)

// Check to see if the useMaFilter check box is checked, this then inputs this conditional "maFilterCheck" variable into the strategy entry
maFilterCheck   = if useMAFilter == true
    maFilter
else
    close
// == /MOVING AVERAGE FILTERING ==

// == PARABOLIC SAR AS AN ENTRY and EXIT OPTION ==
// SAR FILTER: The Parabolic SAR (Stop and Reverse) is a time and price technical analysis tool primarily used to identify points of potential stops and reverses.
// Go long when is located below price (BULLISH) and go short when is located above price (BEARISH).
sarStart        = 0.04 //input(0.04, "SAR Start")
sarIncrement    = 0.02 //input(0.02, "SAR Increment")
sarMaximum      = 0.5 //input(0.5, "SAR Max Value")

htclose         = close
sarOut          = useSARFilter or useSARStop ? sar(sarStart, sarIncrement, sarMaximum) : na
Trend           = sarOut < htclose ? 1 : -1

//Buy and Sell Filter
sarBuyCheck     = useSARFilter? Trend == 1: true
sarSellCheck    = useSARFilter? Trend == -1: true

// Trigger stop based on High/Low
trigResistance  = high
trigSupport     = low

// Determine if price is above resistance or below support
sarResistanceHit    = close >= sarOut and useSARStop == true
sarSupportHit       = close <= sarOut and useSARStop == true
// == /PARABOLIC SAR AS AN ENTRY and EXIT OPTION ==

// == EXITS ==
// == ATR TRAILING STOPS ==
// The ATR % stop method can be used by any type of trader because the width of the stop is determined by the percentage of average true range (ATR).
// ATR is a measure of volatility over a specified period of time.
// Exit with ATR support/resistance is hit.
atrLookback     = 14 //input(defval=14,title="ATR Lookback Period",type=input.integer)
multiplier      = input(defval=2,title="ATR Trailing Stop Multiplier",type=input.float, step=0.1, minval=0.5, maxval=5)

// Calculate the trailing ATR
atrValue        = atr(atrLookback)
atrMultiplied   = atrValue * multiplier

// Plot the price plus or minus the ATR
atrLow          = low - atrMultiplied
atrHigh         = high + atrMultiplied

// Calculate both the low and high trailing ATRs every time. The low one never goes down, and the high one never goes up
// Set them to something to start with
trailAtrLow     = atrLow
trailAtrHigh    = atrHigh

// If the ATR Low has gone up AND it has gone above the trail, the low trailing ATR should also go up. If the ATR Low has gone up or down, but not below the trail, the ATR trail stays where it is
trailAtrLow     := na(trailAtrLow[1]) ? trailAtrLow : atrLow >= trailAtrLow[1] ? atrLow : trailAtrLow[1]
// Same for the High
trailAtrHigh    := na(trailAtrHigh[1]) ? trailAtrHigh : atrHigh <= trailAtrHigh[1] ? atrHigh : trailAtrHigh[1]

// Determine if price is above resistance or below support
atrResistanceHit    = trigResistance >= trailAtrHigh and useATRStop == true
atrSupportHit       = trigSupport <= trailAtrLow and useATRStop == true

// If price is above resistance or below support, reset the trailing ATR
trailAtrLow     := atrSupportHit ? atrLow : trailAtrLow
trailAtrHigh    := atrResistanceHit ? atrHigh : trailAtrHigh
// == /ATR TRAILING STOPS ==

// == INITIAL TP==
// ATR
tpmultiplier   = input(defval=3,title="ATR Take Profit Multiplier",type=input.float, step=0.1, minval=0.5, maxval=5)

ema = ema(close, atrLookback)
atr = rma(tr(true), atrLookback)

longATRTP     = ema + (atr * tpmultiplier)
shortATRTP    = ema - (atr * tpmultiplier)

// Determine if price is above resistance or below support
longATRTPHit    = high >= longATRTP and useATRTP == true
shortATRTPHit   = low <= shortATRTP and useATRTP == true

// STANDARD TAKE PROFIT %
// User Options to Change Inputs (%)
takePer = input(10, title='Take Profit %', type=input.float, step=0.1, minval=0.5, maxval=100) / 100

//fixed TP prices
longPercentTP   = ema * (1 + takePer)
shortPercentTP  = ema * (1 - takePer)

// Determine if price is above resistance or below support
longPercentTPHit    = high >= longPercentTP and usePercentTP == true
shortPercentTPHit   = low <= shortPercentTP and usePercentTP == true

// Set Stop and TP Values
buyStop     = trailStop == 'ATR'? trailAtrLow : trailStop == 'SAR'? sarOut : na
sellStop    = trailStop == 'ATR'? trailAtrHigh : trailStop == 'SAR'? sarOut : na
longTP      = TPtarget == 'ATR'? longATRTP : TPtarget == 'Percent'? longPercentTP : na
shortTP     = TPtarget == 'ATR'? shortATRTP : TPtarget == 'Percent'? shortPercentTP : na

// == /EXITS ==

// == PLOTTING ==
buySignal       = break_up and ADXBuyCheck and close >= maFilterCheck and sarBuyCheck
shortSignal     = break_down and ADXSellCheck and close <= maFilterCheck and sarSellCheck
sellSignal      = atrSupportHit or sarSupportHit or longPercentTPHit or longATRTPHit
coverSignal     = atrResistanceHit or sarResistanceHit or shortPercentTPHit or shortATRTPHit

//Set BarSince counter
barsSinceLong   = 0
barsSinceShort  = 0
barsSinceLong   := nz(barsSinceLong[1])
barsSinceShort  := nz(barsSinceShort[1])

//Plot Sell and Cover Signal
plotshape(not showexitsignals and sellSignal and barsSinceLong == 1? sellSignal : na, title="Sell Long", location=location.abovebar, style=shape.diamond, size=size.auto, color=color.aqua, transp=0, show_last = v_show_last, editable = false)
plotshape(not showexitsignals and coverSignal and barsSinceShort == 1 ? coverSignal : na, title="Cover Short", location=location.belowbar, style=shape.diamond, size=size.auto, color=color.orange, transp=0, show_last = v_show_last, editable = false)
plotshape(showexitsignals and sellSignal and barsSinceLong == 1? sellSignal : na, title="Close Long Text", location=location.abovebar, style=shape.diamond, size=size.auto, color=color.aqua, transp=0, show_last = v_show_last, textcolor=color.aqua, text = "Close\nLong", editable = false)
plotshape(showexitsignals and coverSignal and barsSinceShort == 1 ? coverSignal : na, title="Cover Short Text", location=location.belowbar, style=shape.diamond, size=size.auto, color=color.orange, transp=0, show_last = v_show_last, textcolor=color.orange, text = "Cover\nShort", editable = false)

// Reset BarSince counter
if buySignal
    barsSinceLong := 1
    barsSinceShort := 0
if shortSignal
    barsSinceShort := 1
    barsSinceLong := 0
if sellSignal
    barsSinceLong := 0
if coverSignal
    barsSinceShort := 0

// Show bar color
barcolor(showBarColor? (buySignal or shortSignal ? (shortSignal ? color.fuchsia : color.yellow) : na) : na)

// Plot Buy Alerts
plotshape(buySignal ? buySignal : na, title="Breakout Up", location=location.belowbar, style=shape.circle, size=size.auto, color=color.yellow, transp=0, editable = false)
plotshape(showsignals and buySignal, title= "Long", color=color.green, style=shape.labelup, location=location.belowbar, size=size.auto, show_last = v_show_last, text = "BUY", textcolor=color.white, editable = false)

// Plot Sell Alerts
plotshape(shortSignal ? shortSignal : na, title="Breakout Down", location=location.abovebar, style=shape.circle, size=size.auto, color=color.fuchsia, transp=0, editable = false)
plotshape(showsignals and shortSignal, title= "Short", color=color.red, style=shape.labeldown, location=location.abovebar, size=size.auto, show_last = v_show_last, text = "SELL", textcolor=color.white, editable = false)

// Plot MA Trend Filter
plot(useMAFilter? maFilter : na, title = "Trend Filter MA", color = color.green, linewidth = 2, style = plot.style_line, transp = 20, editable = true)

// Plot Initial Stop
plot(trailStop != 'None' and barsSinceLong >= 1? buyStop : na, color=#3A6CA8, title="Trail Stop Long", style = plot.style_cross, linewidth = 1, transp = 20, editable = true)
plot(trailStop != 'None' and barsSinceShort >= 1? sellStop : na, color=#3A6CA8, title="Trail Stop Short", style = plot.style_cross, linewidth = 1, transp = 20, editable = true)

// Plot Initial Target Profit
plot(TPtarget != 'None' and buySignal? longTP : na, color=color.green, title="LongTP", style = plot.style_linebr, linewidth = 1, editable = false)
plot(TPtarget != 'None' and shortSignal? shortTP : na, color=color.green, title="ShortTP", style = plot.style_linebr, linewidth = 1, editable = false)

// == /PLOTTING ==

// == ALERTS ==
// Buy and Sell Signal
alertcondition(buySignal, title='MACD Long', message='MACD {{exchange}}:{{ticker}} TF: {{interval}}. LONG (TRADE). ENTRY: {{close}}, Target Profit: {{plot("LongTP")}}, STOP LOSS: {{plot("Trail Stop Long")}}')
alertcondition(shortSignal, title='MACD Short', message='MACD {{exchange}}:{{ticker}} TF: {{interval}}. SHORT (TRADE). ENTRY: {{close}}, Target Profit: {{plot("ShortTP")}}, STOP LOSS: {{plot("Trail Stop Short")}}')
alertcondition(sellSignal, title='MACD Close Long', message='MACD {{exchange}}:{{ticker}} Close Long, Price = {{close}}')
alertcondition(coverSignal, title='MACD Cover Short', message='MACD {{exchange}}:{{ticker}} Cover Short, Price = {{close}}')
alertcondition(sellSignal or coverSignal, title="MACD Close Orders", message="{{ticker}} Close Orders")

// Initial SL and TP Hit
stophit = low <= buyStop or high >= sellStop
tphit   = low <= shortTP or high >= longTP
alertcondition(stophit, title='MACD SL Hit', message='MACD {{exchange}}:{{ticker}} Stop Loss Hit, Price = {{close}}')
alertcondition(tphit, title='MACD TP Hit', message='MACD {{exchange}}:{{ticker}} Target Profit Hit, Price = {{close}}')

//Divergence Alerts
alertcondition(regular_bullish_div, title='MACD Bullish Divergence', message='MACD Regular Bullish Divergence')
alertcondition(regular_bearish_div, title='MACD Bearish Divergence', message='MACD Regular Bearish Divergence')
alertcondition(hidden_bullish_div, title='MACD Hidden Bullish Divergence', message='MACD Hidden Bullish Divergence')
alertcondition(hidden_bearish_div, title='MACD Hidden Bearish Divergence', message='MACD Hidden Bearish Divergence')
// == /ALERTS ==

//////////////////////////
//* STRATEGY COMPONENT *//
//////////////////////////

// === BACKTEST RANGE ===
From_Year   = input(defval = 2017, title = "BACKTEST: From Year")
From_Month  = input(defval = 1, title = "BACKTEST: From Month", minval = 1, maxval = 12)
From_Day    = input(defval = 1, title = "BACKTEST: From Day", minval = 1, maxval = 31)
To_Year     = input(defval = 9999, title = "BACKTEST: To Year")
To_Month    = input(defval = 1, title = "BACKTEST: To Month", minval = 1, maxval = 12)
To_Day      = input(defval = 1, title = "BACKTEST: To Day", minval = 1, maxval = 31)
Start       = timestamp(From_Year, From_Month, From_Day, 00, 00)  // backtest start window
Finish      = timestamp(To_Year, To_Month, To_Day, 23, 59)        // backtest finish window

testPeriod() => true
// === /BACKTEST RANGE ===

// === STRATEGY ===
// Make input option to configure trade direction
tradeDirection = input(title="Trade Direction", defval="Both", options=["Long", "Short", "Both"])

// Translate input into trading conditions
longOK  = (tradeDirection == "Long") or (tradeDirection == "Both")
shortOK = (tradeDirection == "Short") or (tradeDirection == "Both")

// == STRATEGY ENTRIES/EXITS ==
timedExit   = input(title = "Use Timed Exit", type = input.bool, defval = true)
exitmethod  = input(title="Timed Exit Method", defval='3', options=['1', '2', '3'])
bse         = input(10, "Bar Since Entry") // Bars to exit after entry

barsSinceEntry  = 0
barsSinceEntry  := nz(barsSinceEntry[1]) + 1

longCondition = longOK and buySignal and testPeriod()
shortcondition = shortOK and shortSignal and testPeriod()

if strategy.position_size == 0
    barsSinceEntry := 0

// === STRATEGY - LONG POSITION EXECUTION ===
if longCondition
    strategy.entry("Long", strategy.long)
    barsSinceEntry := 0

// === STRATEGY - SHORT POSITION EXECUTION ===
if shortcondition
    strategy.entry("Short", strategy.short)
    barsSinceEntry := 0

// == STRATEGY EXITS ==
if sellSignal
    strategy.close("Long")
    barsSinceEntry := 0
if coverSignal
    strategy.close("Short")
    barsSinceEntry := 0

// Enable Timed Exit
// Exit after specified number of bars.
if timedExit and exitmethod == '1' and barsSinceEntry > bse
    strategy.close_all()
    barsSinceEntry := 0
// Exit after specified number of bars, ONLY if position is currently profitable.
if timedExit and exitmethod == '2' and strategy.openprofit > 0 and barsSinceEntry > bse
    strategy.close_all()
    barsSinceEntry := 0
// Exit after specified number of bars, ONLY if position is currently losing.
if timedExit and exitmethod == '3' and strategy.openprofit < 0 and barsSinceEntry > bse
    strategy.close_all()
    barsSinceEntry := 0
// === /STRATEGY ===
//EOF