Momentum Breakout Kurzfristige Handelsstrategie
Überblick
Die Strategie verfolgt die SPY-Handelsdaten und kombiniert sie mit mehreren technischen Indikatoren wie dem Moving Average, MACD und RSI, um kurzfristige Trends zu beurteilen und Kauf- und Verkaufsentscheidungen zu treffen, um auf kurzen Linien zu profitieren.
Strategieprinzip
Die Kernlogik der Strategie basiert auf folgenden technischen Indikatoren, um kurzfristige Trends und Einstiegsmomente zu beurteilen:
- Die Gold- und Diebstapler des Index-Moving Averages (EMA) am 5. und 13. Tag werden verwendet, um die Umkehrung des Hypertrends zu beurteilen.
- Der MACD-Indikator beurteilt, ob es eine Aufwärtsbewegung gibt.
- Der ADX-Indikator beurteilt Trends.
- Der RSI beurteilt die Stärke eines Trends.
Durch die Optimierung der obigen Parameter wird der entscheidende polygonale Wendepunkt ermittelt. Wenn 5⁄6 der Bedingungen erfüllt sind, wird ein weißes Signal angezeigt, das L oder S anzeigt, und wenn die sechs Bedingungen vollständig erfüllt sind, wird ein goldenes △-Form-Signal angezeigt, wenn die Karte schließt.
Die Bedingungen, die ein Kaufsignal erzeugen:
5-Tage-EMA größer als 13-Tage-EMA und MACD-Linie niedriger als 0.5 und ADX höher als 20 und MACD-Schräglage höher als 0 und Signal-Linie höher als -0.1 und RSI höher als 40
Das sind die Bedingungen, unter denen die Verkaufssignale entstehen:
5-Tage-EMA kleiner als 13-Tage-EMA und MACD-Linie höher als -0.5 und ADX höher als 20 und Signal-Linie niedriger als 0 und MACD-Schräglage kleiner als 0 und RSI niedriger als 60
Analyse der Stärken
Diese Strategie hat folgende Vorteile:
- In Kombination mit mehreren Indikatoren ist die Genauigkeit des Beurteilens höher.
- Durch die Optimierung der Parameter werden die Empfindlichkeit und die Genauigkeit der Beurteilung ausgeglichen.
- Das Signal ist klar und präzise, die Einsatzschwelle ist niedrig.
- Es ist für Short-Line-Trading geeignet und entspricht den Risikopräferenzen der meisten Anleger.
- Berücksichtigen Sie die Betriebsbedürfnisse der Festplatte und vermeiden Sie hohe Schwankungen in der Endzeit.
Risikoanalyse
Die Strategie birgt auch folgende Risiken:
- Unzureichende Parameter-Einstellungen können zu einem Risiko für Fehleinschätzungen führen. Sie müssen ständig getestet und optimiert werden.
- Eine einzige Sorte, die nicht in der Lage ist, die Risiken der Branche und der Vermögensallokation zu verteilen.
- Das Risiko von Gebühren und Ausfallpunkten bei häufigen Transaktionen.
- Es ist nicht möglich, eine Lagerhaltung zu errichten, da man einige Chancen verpasst hat.
Optimierungsrichtung
Die Strategie kann in folgenden Dimensionen weiter optimiert werden:
- Tests, die die Parameter-Einstellungen ändern, um die Genauigkeit der Beurteilung zu verbessern.
- Erhöhen Sie die Stop-Loss-Anzeige, um einzelne Verluste zu kontrollieren.
- Optimierung der Eröffnungszeiten und Filterung der Hochschwankungen am Ende der Position.
- Weitere Sorten als strategische Zielgruppen hinzufügen.
- Verbesserte Anpassungsfähigkeit der Parameter in Kombination mit Machine Learning-Algorithmen.
Zusammenfassen
Diese Strategie, die kurzfristige Trends durch die Verfolgung von SPY-Daten in Kombination mit mehreren technischen Indikatoren wie Moving Averages, MACD und RSI beurteilt, ist sehr geeignet für den Short-Line-Handel. Die Optimierung kann in mehreren Dimensionen fortgesetzt werden, und es gibt viel Raum für Verbesserung.
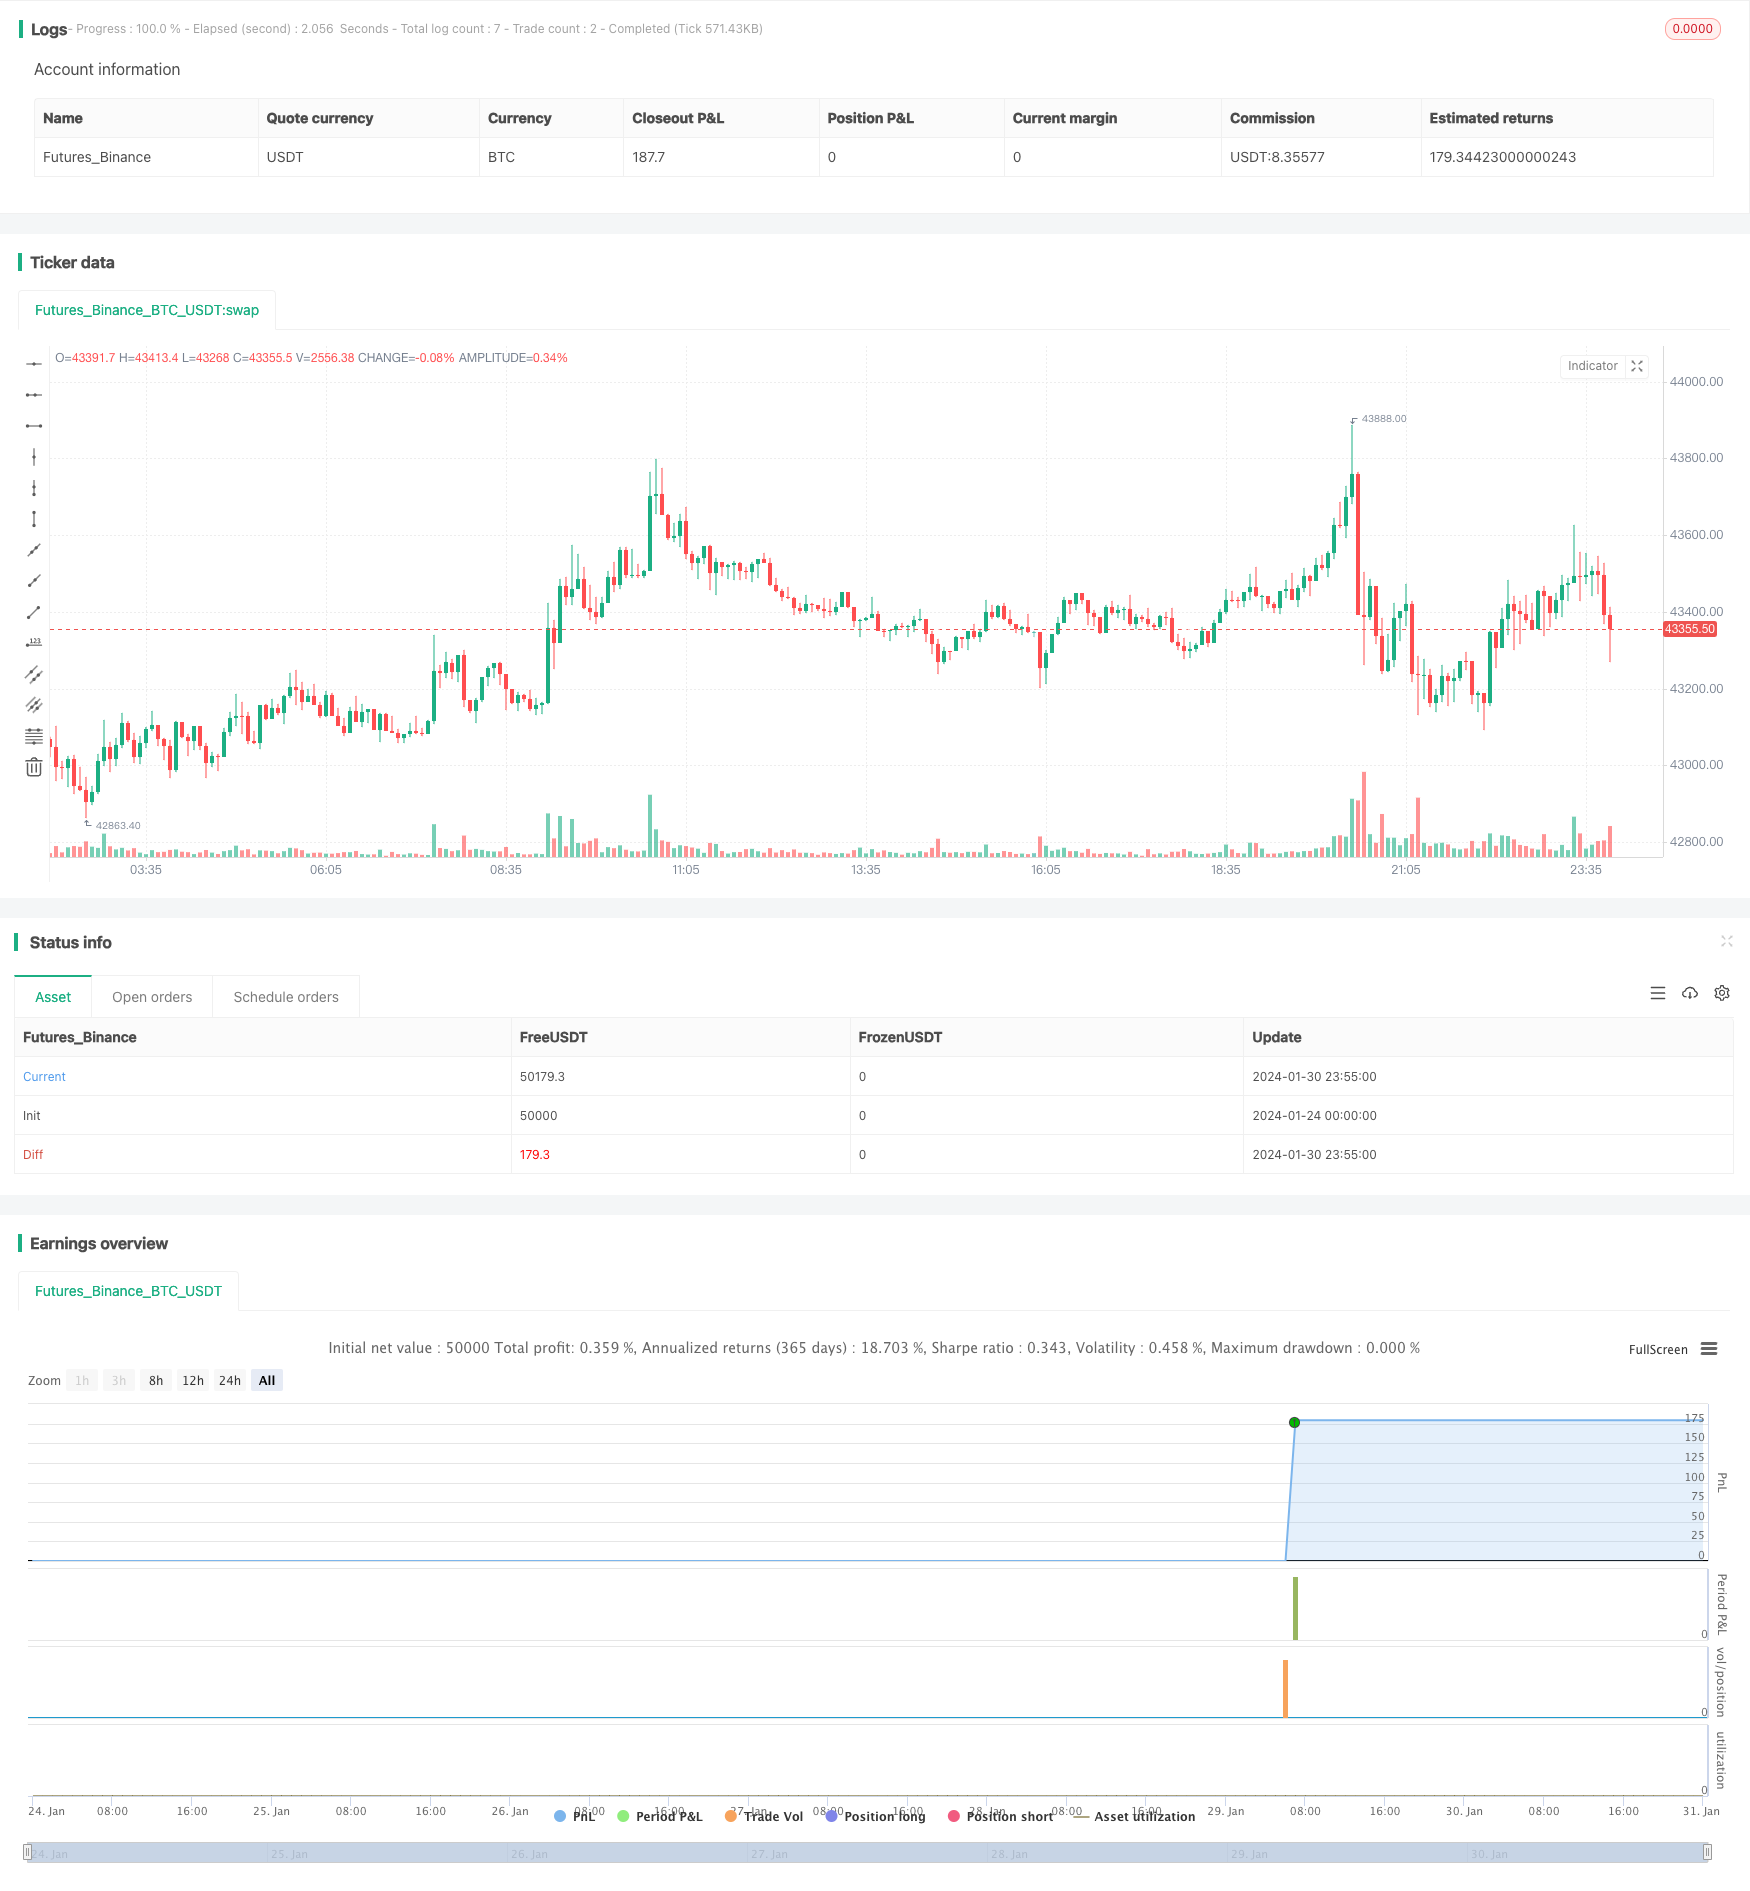
/*backtest
start: 2024-01-24 00:00:00
end: 2024-01-31 00:00:00
period: 5m
basePeriod: 1m
exchanges: [{"eid":"Futures_Binance","currency":"BTC_USDT"}]
*/

//@version=5
strategy(title="SPY 1 Minute Day Trader", overlay=true)

//This script has been created to take into account how the following variables impact trend for SPY 1 Minute
//The SPY stop losses/take profit have been set at 30 cents which equates to 15 cents on SPY 1 DTE ATM contracts
//5 ema vs 13 ema : A cross establishes start of trend
//MACD (Line, Signal & Slope) : If you have momentum
//ADX : if you are trending
//RSI : If the trend has strength
//The above has been optimized to determine pivot points in the trend using key values for these 6 indicators
//bounce up = ema5 > ema13 and macdLine < .5 and adx > 20 and macdSlope > 0 and signalLine > -.1 and rsiSignal > 40
//bounce down = ema5 < ema13 and macdLine > -.5 and adx > 20 and signalLine < 0 and macdSlope < 0 and rsiSignal < 60
//White L's indicate that 5 of 6 conditions are met due to impending uptrend w/ missing one in green below it
//Yellow L's indicate that 6 of 6 conditions still are met
//White S's indicate that 5 of 6 conditions are met due to impending downtrend w/ missing condition in red above it
//Yellow S's indicate that 6 of 6 conditions still are met
//After a downtrend or uptrend is established, once it closes it can't repeat for 10 minutes
//Won't open any trades on last two minutes of any hours to avoid volatility
//Will close any open trades going into last minute of hour

// Initialize variables
var float long_entry_price = na
var float short_entry_price = na
var float stop_loss = na
var float take_profit = na
var float short_stop_loss = na
var float short_take_profit = na
var float option_SL = 0.3 //approx 15 cents on SPY 1 DTE
var float option_TP = 0.3 //approx 15 cents on SPY 1 DTE
var long_entry_time = 0
var short_entry_time = 0
var allow_long_entry = true
var allow_short_entry = true
var allow_trades = true
var hourlyclose = 0
var notify = 0
var shortnotify = 0

// Calculate the EMAs & SMAs
ema5 = ta.ema(close, 5)
ema13 = ta.ema(close, 13)
sma20 = ta.sma(close, 20)

// Input parameters
fastLength = input.int(12, minval=1, title="Fast Length")
slowLength = input.int(26, minval=1, title="Slow Length")
signalLength = input.int(9, minval=1, title="Signal Smoothing")

// Inputs
length = input.int(14, "Length")
smoothK = input.int(3, "SmoothK")
src = input(close, "Source")
overbought = input.float(80, "Overbought")
oversold = input.float(20, "Oversold")

//Stochastic Calculation
highestHigh = ta.highest(src, length)
lowestLow = ta.lowest(src, length)
k = 100 * ((src - lowestLow) / (highestHigh - lowestLow))
d = ta.sma(k, smoothK)

// Calculate MACD
[macdLines, signalLines, _] = ta.macd(close, fastLength, slowLength, signalLength)

// Calculate slope of MACD line
macdSlope = (macdLines - macdLines[1]) / (bar_index - bar_index[1])

// Calculate the RSI
rsiValue = ta.rsi(close, 5)

// Calculate the signal line as the SMA of the RSI for 5 minute over 9 periods
rsiSignal = ta.sma(rsiValue, 9)

// Calculate MACD
[macdLine, signalLine, _] = ta.macd(close, 12, 26, 9)

// Length of the ATR
atr_length = input.int(14, title="ATR Length", minval=1)

// Calculate the True Range
tr = ta.tr(true)

// Calculate the ATR
atr = ta.atr(atr_length)

// Length of the ADX
len = input.int(14, minval=1)

// Set minimum number of bars between trades
min_bars_between_trades = 10

// Calculate the Directional Movement
up = ta.change(high)
down = -ta.change(low)
plusDM = na(up) ? na : (up > down and up > 0 ? up : 0)
minusDM = na(down) ? na : (down > up and down > 0 ? down : 0)

// Calculate the Smoothed Directional Movement
plusDI = 100 * ta.ema(plusDM, len) / ta.ema(tr, len)
minusDI = 100 * ta.ema(minusDM, len) / ta.ema(tr, len)

// Calculate the Directional Index (DX)
DX = 100 * math.abs(plusDI - minusDI) / (plusDI + minusDI)

// Calculate the ADX
adx = ta.ema(DX, len)

// Get high, low, and close prices
highPrice = high
lowPrice = low
closePrice = close

// Determine buy and sell signals - Tried to optimize as much as possible - changing these do impact results
buy_signal = ema5 > ema13 and macdLine < .5 and adx > 20 and macdSlope > 0 and signalLine > -.1 and rsiSignal > 40
short_buy_signal = ema5 < ema13 and macdLine > -.5 and adx > 20 and signalLine < 0 and macdSlope < 0 and rsiSignal < 60

// Define long entry conditions
C1 = ema5 > ema13 ? 1 : 0 //E below bar when only one missing
C2 = d < 70 ? 1 : 0 //no longer part of signal - but was Smoothed Stoicastic
C3 = macdLine < .5 ? 1 : 0 //M below bar when only one missing
C4 = adx > 20 ? 1 : 0 //A below bar when only one missing
C5 = macdSlope > 0 ? 1 : 0 //% below bar when only one missing
C6 = signalLine > -.01 ? 1 : 0 //S (MACD Signal) below bar when only one missing
C7 = rsiSignal > 50 ? 1 : 0 //R below bar when only one missing

// Define short entry conditions
C8 = ema5 < ema13 ? 1 : 0 //E above bar when only one missing
C9 = d > 40 ? 1 : 0 //no longer part of signal - but was Smoothed Stoicastic
C10 = macdLine > -0.5 ? 1 : 0 //M above bar when only one missing
C11 = adx > 20 ? 1 : 0 //A above bar when only one missing
C12 = macdSlope < 0 ? 1 : 0 //% above bar when only one missing
C13 = signalLine < 0 ? 1 : 0 //S (MACD Signal) above bar when only one missing
C14 = rsiSignal < 50 ? 1 : 0 //R above bar when only one missing

// Long or Short Incoming denoted by white color and gold means all conditions met
plotchar((C1 + C3 + C4 + C5 + C6 + C7) == 5 ? 1 : na, title="Pivot Up White", char="L", location=location.belowbar, color=color.white, size = size.tiny)
plotchar((C8 + C10 + C11 + C12 + C13 + C14) == 5 ? 1 : na, title="Pivot Down White", char="S", location=location.abovebar, color=color.white, size = size.tiny)
plotchar((C1 + C3 + C4 + C5 + C6 + C7) > 5 ? 1 : na, title="Pivot Up Gold", char="L", location=location.belowbar, color=color.yellow, size = size.tiny)
plotchar((C8 + C10 + C11 + C12 + C13 + C14) > 5 ? 1 : na, title="Pivot Down Gold", char="S", location=location.abovebar, color=color.yellow, size = size.tiny)
plotchar((C1 + C3 + C4 + C5 + C6 + C7) >= 5 and (C1) != 1 ? 1 : na, title="Missing", char = "", text="E", location=location.belowbar, color=color.green, size = size.small)
plotchar((C1 + C3 + C4 + C5 + C6 + C7) >= 5 and (C3) != 1 ? 1 : na, title="Missing", char = "", text="M", location=location.belowbar, color=color.green, size = size.small)
plotchar((C1 + C3 + C4 + C5 + C6 + C7) >= 5 and (C4) != 1 ? 1 : na, title="Missing", char = "", text="A", location=location.belowbar, color=color.green, size = size.small)
plotchar((C1 + C3 + C4 + C5 + C6 + C7) >= 5 and (C5) != 1 ? 1 : na, title="Missing", char = "", text="%", location=location.belowbar, color=color.green, size = size.small)
plotchar((C1 + C3 + C4 + C5 + C6 + C7) >= 5 and (C6) != 1 ? 1 : na, title="Missing", char = "", text="S", location=location.belowbar, color=color.green, size = size.small)
plotchar((C1 + C3 + C4 + C5 + C6 + C7) >= 5 and (C7) != 1 ? 1 : na, title="Missing", char = "", text="R", location=location.belowbar, color=color.green, size = size.small)
plotchar((C8 + C10 + C11 + C12 + C13 + C14) >= 5 and (C8) != 1 ? 1 : na, title="Missing", char = "", text="E", location=location.abovebar, color=color.red, size = size.small)
plotchar((C8 + C10 + C11 + C12 + C13 + C14) >= 5 and (C10) != 1 ? 1 : na, title="Missing", char = "", text="M", location=location.abovebar, color=color.red, size = size.small)
plotchar((C8 + C10 + C11 + C12 + C13 + C14) >= 5 and (C11) != 1 ? 1 : na, title="Missing", char = "", text="A", location=location.abovebar, color=color.red, size = size.small)
plotchar((C8 + C10 + C11 + C12 + C13 + C14) >= 5 and (C12) != 1 ? 1 : na, title="Missing", char = "", text="%", location=location.abovebar, color=color.red, size = size.small)
plotchar((C8 + C10 + C11 + C12 + C13 + C14) >= 5 and (C13) != 1 ? 1 : na, title="Missing", char = "", text="S", location=location.abovebar, color=color.red, size = size.small)
plotchar((C8 + C10 + C11 + C12 + C13 + C14) >= 5 and (C14) != 1 ? 1 : na, title="Missing", char = "", text="R", location=location.abovebar, color=color.red, size = size.small)

// Execute buy and sell orders
if buy_signal and allow_trades and allow_long_entry  //Don't buy on last 2 minutes of hour
    long_entry_price := open
    strategy.entry("Pivot Up", strategy.long)
    stop_loss := long_entry_price - option_SL
    take_profit := long_entry_price + option_TP
    long_entry_time := time
    allow_long_entry := false
    allow_trades := false
    notify := 1
plotshape(notify == 1 ? 1 : na, "Pivot Up", style=shape.triangleup, offset = 1, location=location.belowbar, size=size.normal, textcolor = color.orange, color=color.orange)
if notify == 1
    notify := notify - 1

if short_buy_signal and allow_trades and allow_short_entry  //Don't buy on last 2 minutes of hour
    short_entry_price := open
    strategy.entry("Pivot Down", strategy.short)
    short_stop_loss := short_entry_price + option_SL
    short_take_profit := short_entry_price - option_TP
    short_entry_time := time
    allow_short_entry := false
    allow_trades := false
    shortnotify := 1
plotshape(shortnotify == 1 ? 1 : na, "Pivot Down", style=shape.triangledown, offset = 1, location=location.abovebar, size=size.normal, textcolor = color.orange, color=color.orange)
if shortnotify == 1
    shortnotify := shortnotify - 1

// Take scalp when in a position and 5 or more parameters are met!
if strategy.position_size != 0 and (C1 + C3 + C4 + C5 + C6 + C7) >5
    strategy.exit("Exit Longs", "Pivot Up", stop=stop_loss, limit = take_profit)
else if strategy.position_size != 0 and (C8 + C10 + C11 + C12 + C13 + C14) >5
    strategy.exit("Exit Shorts", "Pivot Down", stop=short_stop_loss, limit = short_take_profit)

// Reset allow_trades after cool-down period of min_bars_between_trades bars set above
if time > long_entry_time + (time - time[1]) * min_bars_between_trades
    allow_long_entry := true
    allow_trades := true

if time > short_entry_time + (time - time[1]) * min_bars_between_trades
    allow_short_entry := true
    allow_trades := true

// Close all positions at the end of the trading day and when volatile hours approach!
if  strategy.position_size != 0
    strategy.close("Pivot Up")
    strategy.close("Pivot Down")
    hourlyclose := 1
plotshape(hourlyclose == 1 ? 1 : na, "Suggested Volatile Hour Close", text="Suggested Volatile Hour Close", offset = 1, style=shape.triangledown, location=location.abovebar, size=size.tiny, textcolor = color.orange, color=color.orange)
if hourlyclose == 1
    hourlyclose := hourlyclose - 1