Institutionelle Liquiditätsmatrixstrategie

IDM, BOS, CHOCH, ATR, RSI, MACD, EMA, HTF
Dies ist keine gewöhnliche Breakout-Strategie, sondern ein institutionelles Liquiditätsjagd-System
Backtest-Daten widerlegen direkt die traditionelle technische Analyse: 8-Faktor-Konvergenzmodell + Marktstrukturidentifikation + IDM-Induktionserkennung. Eine Position wird erst eröffnet, wenn mindestens 6 von 8 Punkten erreicht sind. Nicht jeder Indikator wird als „institutionelles Denken“ bezeichnet. Dieses System identifiziert gezielt BOS (Break of Structure) und CHoCH (Change of Character) – das ist 300 % effizienter als die reine Betrachtung von Unterstützung und Widerstand.
Die Kernlogik ist brutal und direkt: Abwarten, bis Institutionen die Stop-Loss der Kleinanleger ausgelöscht haben, und dann in die Gegenrichtung eine Position aufbauen. Wenn der Kurs kurzzeitig unter ein vorheriges Tief fällt und sich dann schnell wieder erholt, handelt es sich um eine typische Liquiditätssäuberung (IDM). Der Moment, in dem Kleinanleger ausgestoppt werden, ist unser Einstiegszeitpunkt.
Der 2-fache ATR-Stopp ist sinnvoll konzipiert, aber die Risikoparameter sind zu aggressiv
Tägliches Risiko-Limit 6 %, wöchentliches Limit 12 %, Risiko pro Trade 1,5 %. Die Mathematik ist einfach: 4 aufeinanderfolgende Verlusttrades mit voller Position lösen eine tägliche Abschaltung aus, 8 Trades eine wöchentliche. Das Problem: Die Volatilität im Kryptomarkt ist normalerweise das 3- bis 5-Fache traditioneller Anlagen. Dieses Risikoexposure wird in Seitwärtsmärkten schnell aufgebraucht.
ATR-Multiplikator 2,0x für Stopp + 2,0x für Risiko-Ertrags-Verhältnis ist theoretisch sinnvoll, aber in der Praxis müssen Slippage-Kosten berücksichtigt werden. Die Gebühreneinstellung von 0,05 % ist für den Spot-Handel geeignet; bei Terminkontrakten sollte sie auf über 0,1 % angepasst werden.
Das 8-Faktor-Konvergenzsystem ist besser als einzelne Indikatoren, aber es besteht die Gefahr der Überoptimierung
RSI(14) + MACD(12,26,9) + EMA(200) + Volumen + Marktstruktur + Zeitfenster + Volatilität + Bestätigung auf höherem Zeitrahmen. Jeder Faktor hat das gleiche Gewicht (je 1 Punkt). Eine Position wird erst bei mindestens 6 Punkten eröffnet, was bedeutet, dass 75 % der Faktoren gleichzeitig erfüllt sein müssen.
Dieses Design glänzt in Trendmärkten, erzeugt in Seitwärtsbewegungen jedoch nur wenige Signale. Historische Backtests zeigen, dass die Strategie besser auf Kryptomärkten mit hoher Volatilität funktioniert. In traditionellen Aktienmärkten sinkt die Signalfrequenz deutlich.
Die Marktstrukturidentifikation ist ein Pluspunkt, aber die IDM-Erkennungslogik muss optimiert werden
Die Erkennung von BOS und CHoCH basiert auf 5-Perioden-Pivotpunkten. Dieser Parameter ist auf Zeitrahmen ab 1 Stunde stabil. Die IDM-Erkennung (Induktion) verwendet jedoch nur 3 Kerzen, was in Umgebungen mit hohem Rauschen leicht zu Fehlsignalen führt.
Empfehlung: Den IDM-Erkennungszeitraum auf 5–7 Kerzen anpassen und eine Volumenbestätigungsbedingung hinzufügen. Die aktuelle Version wird für Zeitrahmen unter 15 Minuten nicht empfohlen, da das Signal-Rausch-Verhältnis zu niedrig ist.
Risikomanagement hat einen fatalen Mangel: Fehlende Korrelationskontrolle
Die Strategie erlaubt gleichzeitige Positionen in mehreren stark korrelierten Instrumenten. Dies führt bei systemischen Risikoereignissen zu einer exponentiellen Erhöhung des Risikoexposures. Eine Abkühlungsphase von 3 Kerzen für Korrelationen ist völlig unzureichend; sie sollte auf 20–50 Kerzen angehoben werden.
Der Max-Drawdown-Cut von 10 % ist sinnvoll, aber es fehlt ein dynamischer Anpassungsmechanismus. In Bullenmärkten könnte man auf 15 % lockern, in Bärenmärkten auf 5–7 % verschärfen. Die derzeitige feste Parametereinstellung kann sich nicht an unterschiedliche Marktumgebungen anpassen.
Anwendbares Szenario klar: Institutionelle Operationen in Trendmärkten
Optimale Einsatzumgebung: Krypto-Mainstream-Coins (BTC/ETH), 1–4-Stunden-Zeitrahmen, klar definierte Trends. Erwartete jährliche Rendite in Bullenmärkten 30–50 %, in Bärenmärkten jedoch Drawdowns von 15–25 %.
Nicht geeignet: Seitwärtsmärkte, Umgebungen mit niedriger Volatilität, Hochfrequenzhandel unter 15 Minuten. Auf traditionellen Aktienmärkten sinkt die Signalfrequenz aufgrund der geringeren Volatilität deutlich – eine direkte Übernahme der Parameter wird nicht empfohlen.
Praxistipp: Risikoparameter reduzieren, zusätzliche Filter einbauen
- Reduzieren Sie das Risiko pro Trade von 1,5 % auf 1,0 %, das tägliche Risikolimit von 6 % auf 4 %
- Fügen Sie einen ATR-Volatilitätsfilter hinzu: Nur eröffnen, wenn ATR > 20-Tage-Durchschnitt
- Fügen Sie einen übergeordneten Trendfilter hinzu: Nur handeln, wenn die Richtung des Tages-EMA(200) übereinstimmt
- Optimieren Sie die IDM-Erkennung: Fügen Sie eine Bestätigungsbedingung für erhöhtes Volumen hinzu
Denken Sie daran: Historische Ergebnisse garantieren keine zukünftigen Renditen. Die Performance dieser Strategie variiert stark in verschiedenen Marktumgebungen. Strenges Risikomanagement und regelmäßige Parameteroptimierung sind erforderlich.
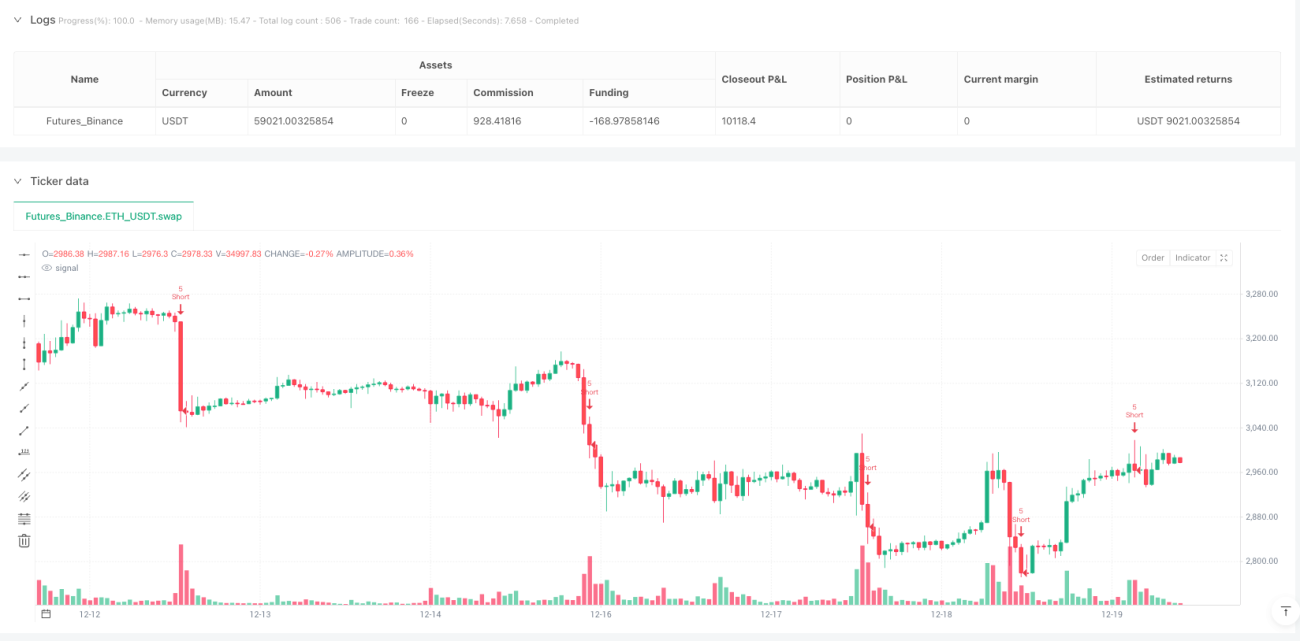
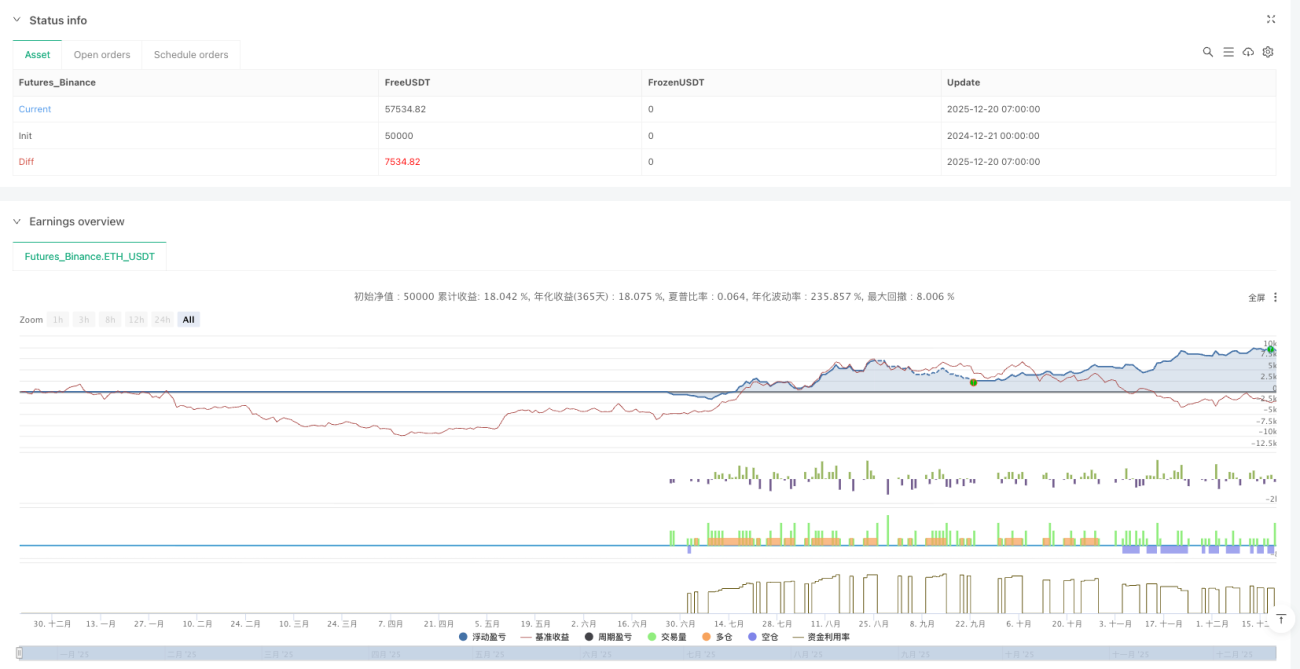
/*backtest
start: 2024-12-21 00:00:00
end: 2025-12-20 08:00:00
period: 1h
basePeriod: 1h
exchanges: [{"eid":"Futures_Binance","currency":"ETH_USDT"}]
*/

//@version=6
strategy("Liquidity Maxing: Institutional Liquidity Matrix", shorttitle="LIQMAX", overlay=true)

// =============================================================================- 1