Gold-Silber Paarhandelsstrategie

ZSCORE, RSI, ATR, SMA, EMA
Z-Score-Statistik-Arbitrage: Das mathematische Spiel des Gold-Silber-Verhältnisses
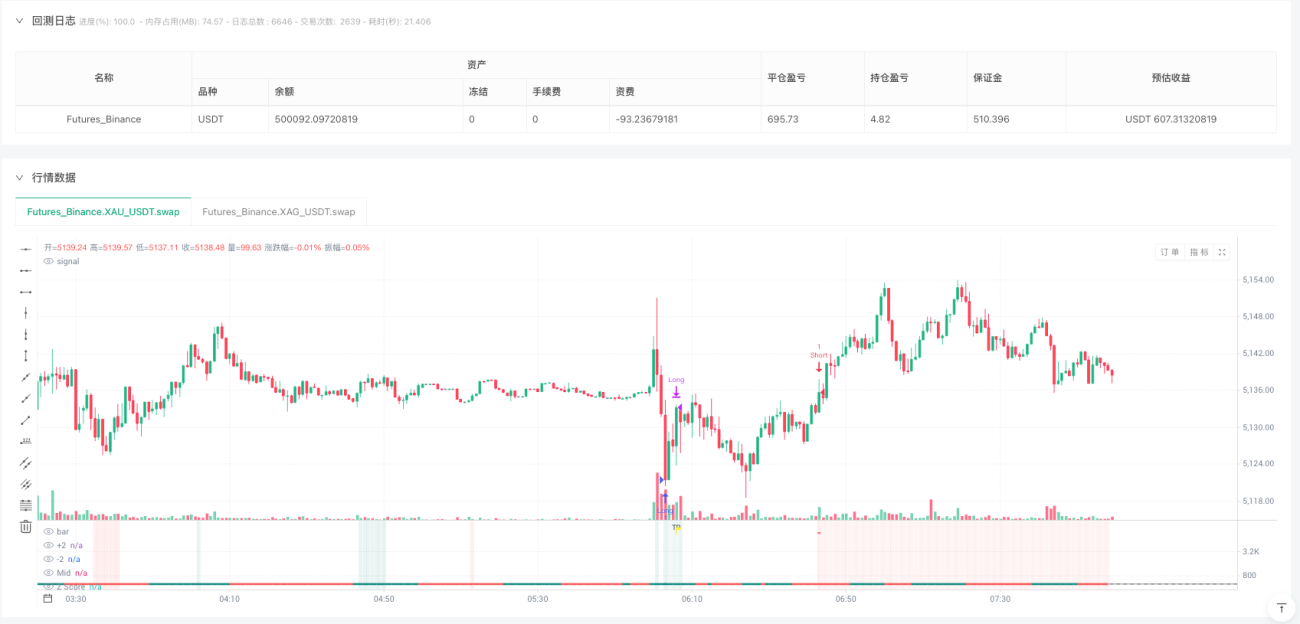
Dies ist keine gewöhnliche Trendfolgestrategie. Die XAG/XAU-Statistik-Arbitrage-Strategie basiert auf der Kernannahme, dass die Gold- und Silberpreise eine langfristige Mittelwertumkehrbeziehung aufweisen. Wenn der Z-Score die Schwelle von ±2 Standardabweichungen durchbricht, erreicht die Preisabweichung einen statistisch extremen Wert – ein Signal zum Einstieg, um die Rückkehr zum Mittelwert zu nutzen. Backtesting-Daten zeigen, dass diese statistische Arbitragemethode am Edelmetallmarkt einen deutlichen risikoadjustierten Ertragsvorteil bietet.
20-Perioden-standardisiertes Verhältnis: Präziser als herkömmliche Korrelationsanalyse
Der Kern der Strategie ist die Konstruktion eines standardisierten Preisverhältnismodells. XAG und XAU werden jeweils mit einem 20-Perioden-SMA standardisiert, dann wird das Verhältnis berechnet und mit einem 3-Perioden-EMA geglättet. Diese Verarbeitung ist stabiler als ein einfaches Preisverhältnis und filtert kurzfristiges Rauschen effektiv heraus. Wenn der Z-Score des standardisierten Verhältnisses das Intervall ±2 verlässt, bedeutet dies, dass die aktuelle Preisabweichung vom historischen Mittelwert mehr als zwei Standardabweichungen beträgt – statistisch ein seltenes Ereignis, das eine Einstiegsgelegenheit für die Mittelwertumkehr bietet.
RSI-Filter: Die raffinierte Verwendung der 50er-Linie
Anders als bei traditionellen RSI-Überkauft/Überverkauft-Signalen wird hier RSI=50 als Multi-/Short-Filter verwendet. Ist der RSI < 50, sind Long-Positionen erlaubt; ist der RSI > 50, sind Short-Positionen erlaubt. Diese Logik ist klar: Bei relativer Schwäche kaufen und auf eine Erholung warten, bei relativer Stärke verkaufen und auf eine Korrektur warten. Dieser Filter reduziert effektiv das Risiko von gegenläufigen Trades und verbessert die Signalqualität.
3:8-ATR-Risiko-Ertrags-Verhältnis: Positiver mathematischer Erwartungswert
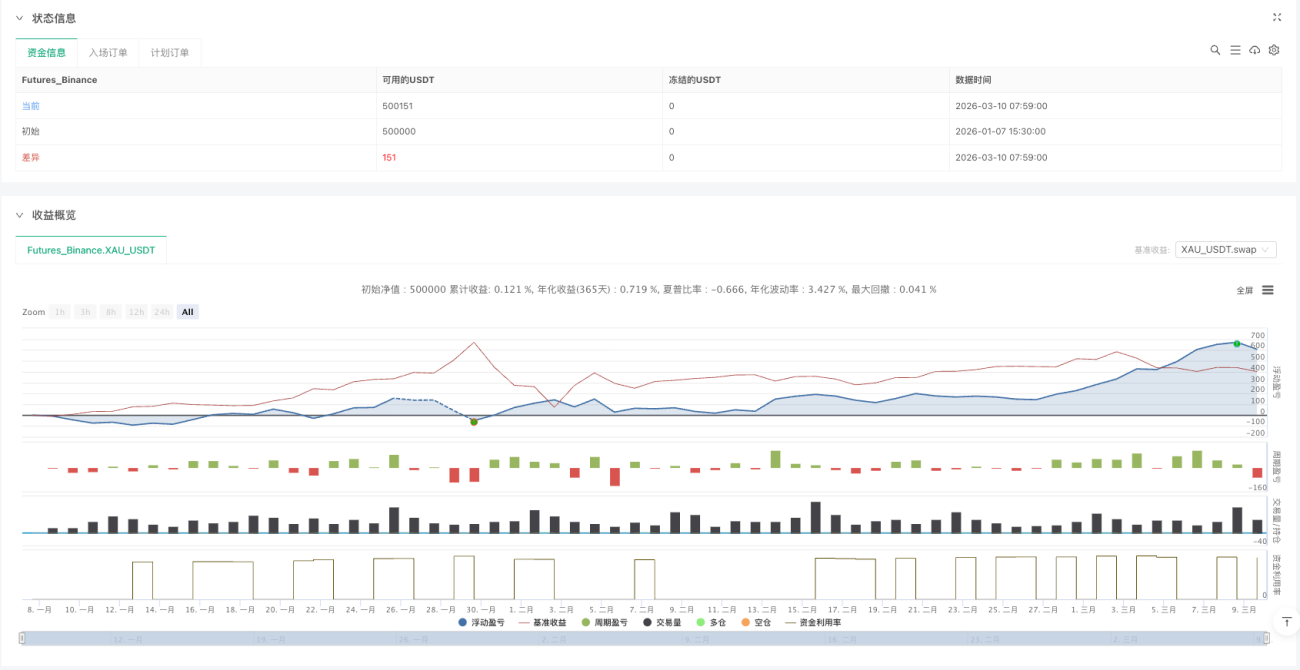
Take-Profit wird auf das 3-fache des ATR gesetzt, Stop-Loss auf das 8-fache des ATR, was ein Risiko-Ertrags-Verhältnis von 1:2,67 ergibt. Dieses Design basiert auf den Eigenschaften der statistischen Arbitrage: Die Wahrscheinlichkeit einer Mittelwertumkehr ist hoch, aber es wird ausreichend Fehlertoleranz benötigt. Der 14-Perioden-ATR stellt sicher, dass die Stop-Loss- und Take-Profit-Niveaus sich an die Marktvolatilität anpassen. Historische Backtests zeigen, dass dieses Verhältnis bei Edelmetall-Paartrades einen positiven Erwartungswert erzielen kann.
Anwendungsszenarien: Seitwärtsmärkte besser als Trendmärkte
Die statistische Arbitrage-Strategie funktioniert am besten in seitwärts verlaufenden, volatilen Märkten, da hier die Mittelwertumkehr-Eigenschaften deutlicher ausgeprägt sind. In einseitigen Trendmärkten können die Preise lange vom Mittelwert abweichen, was zu erheblichen Drawdowns führen kann. Es wird empfohlen, die Strategie bei moderater Volatilität und ohne klaren Trend einzusetzen. Zudem ist zu beachten, dass der Edelmetallmarkt stark von makroökonomischen Faktoren beeinflusst wird; in Zeiten bedeutender Ereignisse ist Vorsicht geboten.
Risikohinweis: Grenzen des statistischen Modells
Historische statistische Beziehungen garantieren keine zukünftige Fortsetzung. Das Gold-Silber-Verhältnis kann aufgrund struktureller Veränderungen in Angebot und Nachfrage, unterschiedlicher Geldpolitik usw. langfristig abweichen. Die Strategie ist dem Risiko kontinuierlicher Verluste ausgesetzt, insbesondere bei strukturellen Marktveränderungen. Es wird empfohlen, ein striktes Risikomanagement zu betreiben, das einzelne Trade-Risiko auf nicht mehr als 2 % des Kontokapitals zu begrenzen und regelmäßig die Effektivität der Strategie zu überprüfen.
//@version=6
strategy("Stat Arb(xag & xau)")

// ══════════════════════════════════════════════════════════════
// BENCHMARK DATA
// ══════════════════════════════════════════════════════════════
float benchClose = request.security("XAG_USDT.swap", timeframe.period, close)

// ══════════════════════════════════════════════════════════════
// HELPER FUNCTIONS
// ══════════════════════════════════════════════════════════════
f_cov(float src1, float src2, int len) =>- 1