Case analysis of several common indicators written in My language and cross-indicator models
Author: Goodness, Created: 2019-07-08 10:01:48, Updated: 2019-07-16 15:38:53My language is a functionally highly integrated and feature-rich quantum programming language designed for quantum beginners. Although it is popular with many beginners, it is slightly inferior in functionality to other programming languages. In terms of deep customization of some complex strategies, due to the already customized library of functions, combined with the excellent support of the API interfaces of the major exchanges, you can not only save a lot of time writing code, but also focus on the design of the main strategy logic, and the extremely low cost (price as low as 3 yuan per day), leaving you with no worries.
My language is not only applicable to domestic commodity futures, but also provides support for digital currency-related transactions without any differences.
This article presents the writing of several common indicators and case studies of several cross-indicator models.
Classification and writing of several commonly used indicators
-
Traditional classic K-line shapes include: three-legged crow, cross star, pierced head broken leg, a pillar of fire, Sendai finger path, golden needle bottom etc.
-
In terms of indicators, trend indicators are further divided into: MA (average line combination), BOLL, PUBU (fall line), SAR (stop loss point) and so on.
-
Swing class indicators: ATR (true wavelength), KDJ (random), MACD, WR (William), and others
-
Quantity of stock analyzed CJL (full volume) DATA (full volume) DATA (full volume) DATA (full volume) DATA (full volume) DATA (full volume) DATA (full volume) DATA (full volume) DATA (full volume) DATA (full volume) DATA (full volume) DATA (full volume) DATA (full volume) DATA (full volume) DATA (full volume) DATA (full volume) DATA (full volume) DATA (full volume) DATA) DATA (full volume) DATA (full volume) DATA (full volume) DATA (full volume) DATA (full volume) DATA (full volume) DATA (full volume) DATA (full volume) DATA (full volume) DATA (full volume) DATA (full volume) DATA (full volume) DATA (full volume) DATA (full volume) DATA (full volume) DATA (full volume) DATA (full volume) DATA (full volume) DATA (full volume) DATA (full volume) DATA (full volume) DATA (full volume) DATA (full volume)
Next, let's use My language to implement these classic forms and indicators one by one on the inventor's quantification platform, the purpose of which is not to allow the reader to use these indicators directly (of course, under certain conditions, direct use may not be a problem), but to allow the reader to review the timing of these indicators and improve them according to the market and their own financial management conditions.
Big Sun Line: The opening price is the lowest price, the closing price is the highest price, and the K Line is up more than 4%.
AA:=OPEN=LOW;
BB:=CLOSE=HIGH;
CC :=CLOSE/OPEN>1.04;
The logical aggregate here is: AA&&BB&&CC
Head-to-toe: Two K lines are formed, indicating that the market will turn, and the current K line has an opening yield of at least 4% deviation. If it is the type of upward head-to-toe, then the K line should sunset, while the current K line's highest price and lowest price should cover the first K line.
A1:=REF(CLOSE,1);
A2:=REF(OPEN,1);
BB:C/O>1.04;
B1:=OPEN<A1;
B2:=CLOSE>A2;
The logical conditions here are: BB&&B1&B2
Indicators in the trend category
- Equatorial cross: 5 days up through 10 days (Golden Fork); 5 days down through 10 days (Dead Fork)
MA5:=MA(CLOSE,5);
MA10:=MA(CLOSE,10);
金叉 CROSSUP(MA5,MA10);
死叉 CROSSDOWN(MA5,MA10);
As you can see, the functions of My language are highly integrated, a function that judges the linear crossover, the user just needs to call it, without having to build each function from scratch from the underlying logic, and it's much easier to tweak later.
Similarly, for a three-line strategy, assuming a 5-day, 10-day, 30-day, multi-headed line that lasts three days, we can write:
MA5:=MA(CLOSE,5);
MA10:=MA(CLOSE,10);
MA30:=MA(CLOSE,30);
CC:=MA5>MA30 AND MA10>MA30;
- BOLL channel: BOLL consists of three channels: Bottom, Top, and Mid. When the channel widens and rises, the price is above the uptrend.
The code in my language can be written like this:
MID:MA(CLOSE,26);//求N个周期的收盘价均线,称为布林通道中轨
TMP2:=STD(CLOSE,26);//求M个周期内的收盘价的标准差
TOP:MID+2*TMP2;//布林通道上轨
BOTTOM:MID-2*TMP2;//布林通道下轨
AA:=TOP>REF(TOP,1)&&BOTTOM<REF(BOTTOM,1)&&MID>REF(MID,1);
BB:=C>TOP;
The criteria for determining the trend are: AA&&BB
- SAR (stop loss point) indicator: SAR up through 0, multi-headed trend; SAR down through 0, blank headed trend.
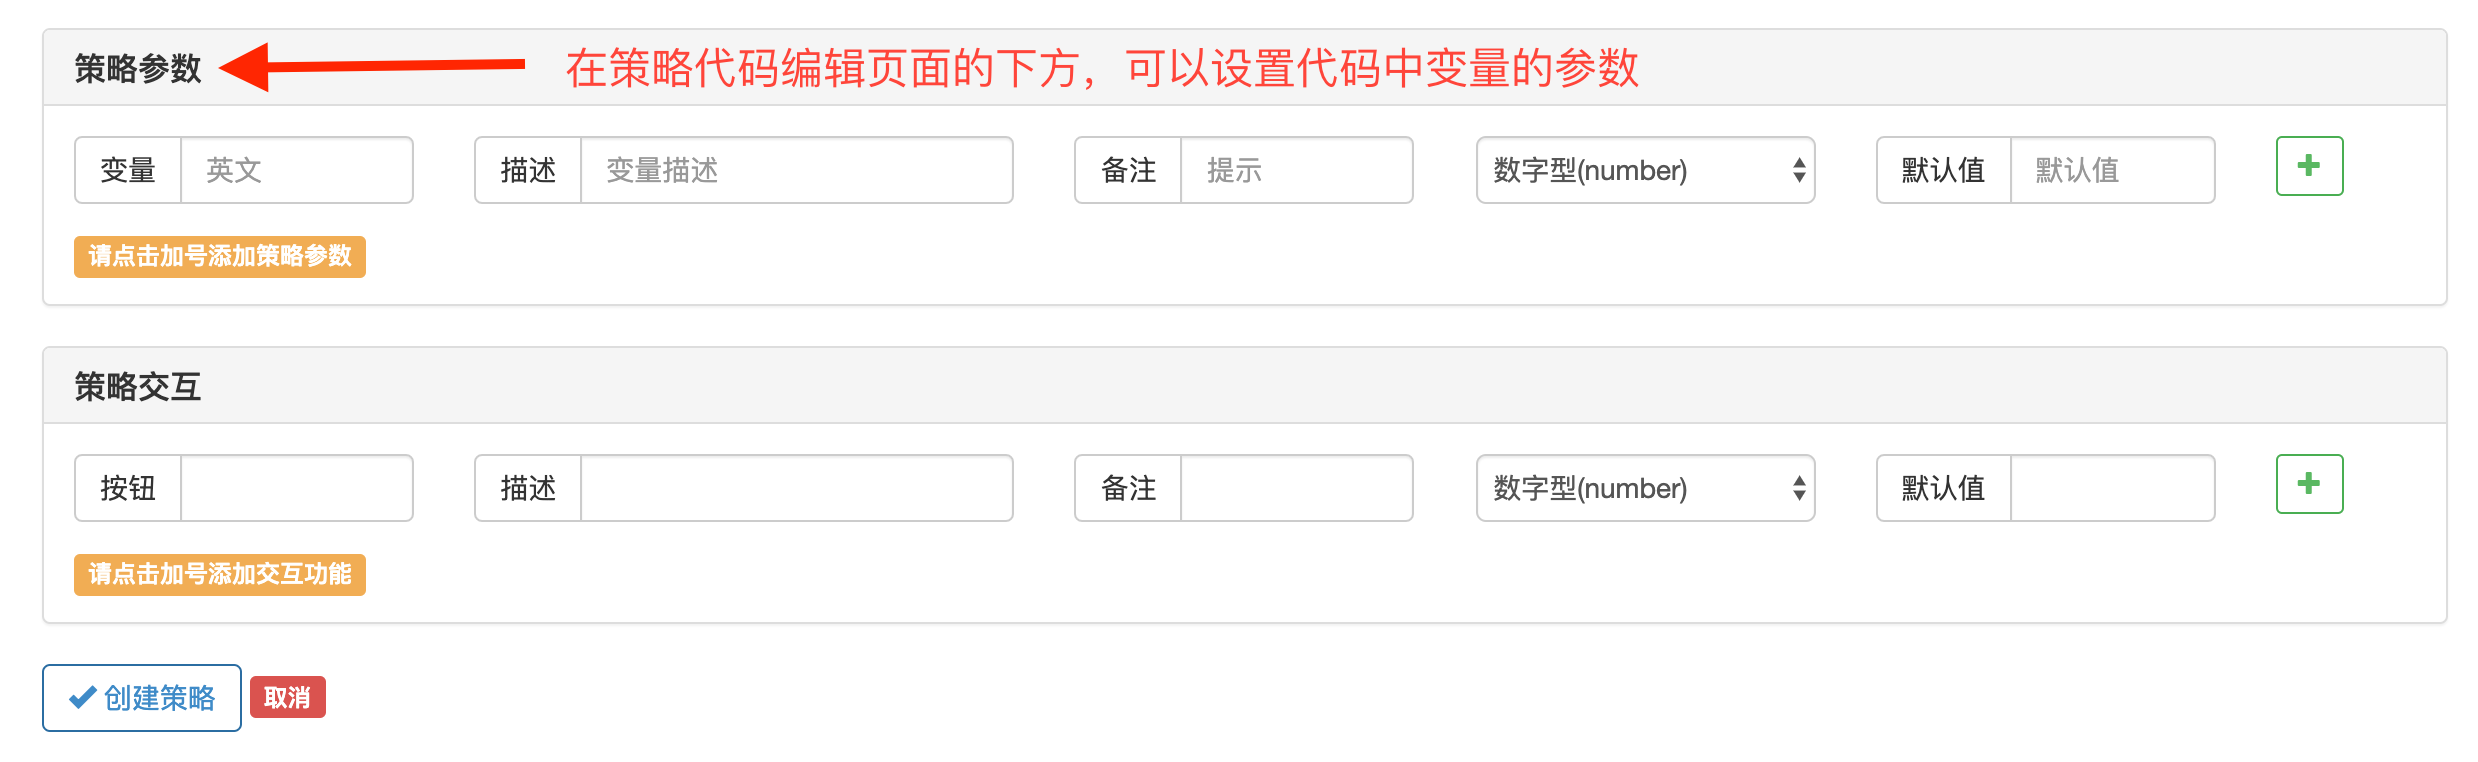
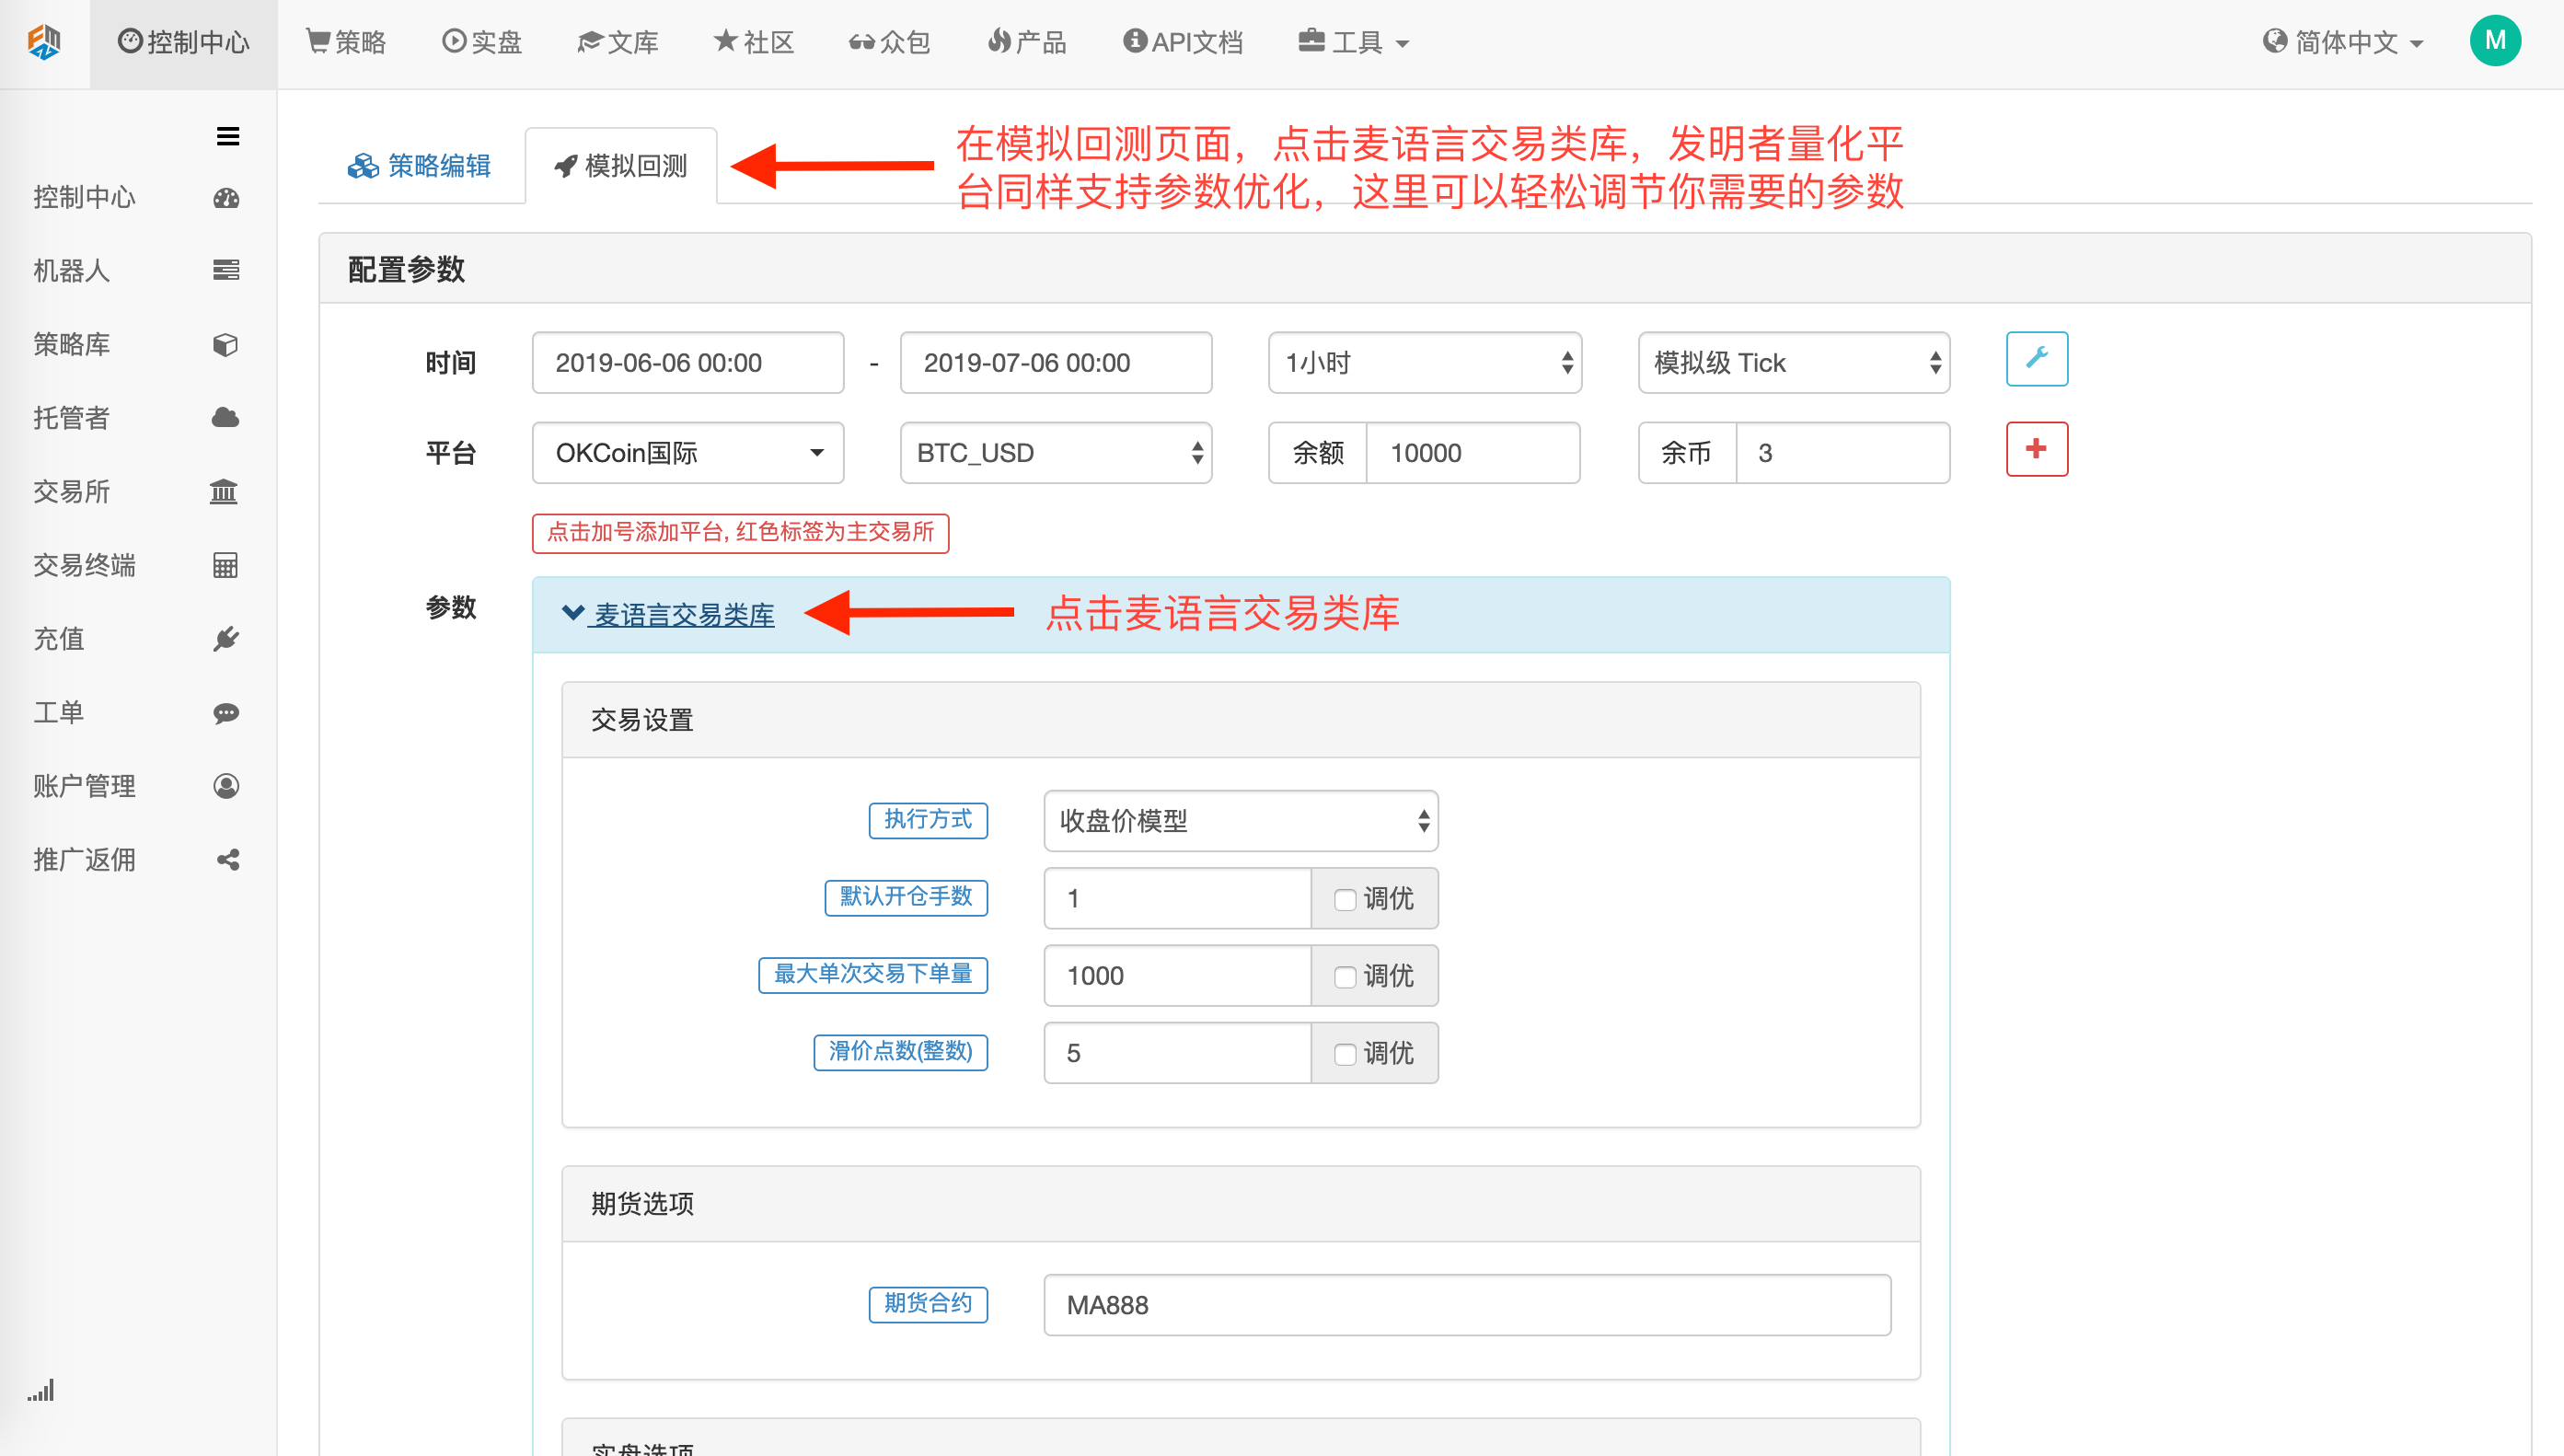
First, we define the following parameters in the Mac language transaction library on the Parameter Bar and Retrieval page under the Inventor Quantified Strategy Code Writing interface:
N 1 100 4 STEP 1 20 2 MVALUE 1 10 2
STEP1:=STEP/100;
MVALUE1:=MVALUE/10;
SARLINE:SAR(N,STEP1,MVALUE1),CIRCLEDOT;
//N个周期的抛物转向,步长为STEP1,极限值为MVALUE1.
CROSS(SARLINE,0),BPK;//抛物转向值上穿0,做多。
CROSS(0,SARLINE),SPK;//抛物转向值下穿0,作空。
AUTOFILTER;
Swing class indicators
Anyone with some experience in trading knows that no matter what market, prices are volatile 80% of the time, and only 20% of the time are trending.
Therefore, swing indicators are more important than trend indicators and have a greater impact on the outcome of trades, and in most volatile markets, trend indicators are largely ineffective. While swing indicators can change with price fluctuations, swing indicators can also be called random indicators.
Characteristics of oscillators: The variation of the oscillating indicator value has a middle value, which can be divided into the upper half and the lower half of the horizontal region, which is generally sensitive to price changes.
It is a good choice to judge the trend coming with the trend class indicator, and to judge the trend ending with the swing class indicator.
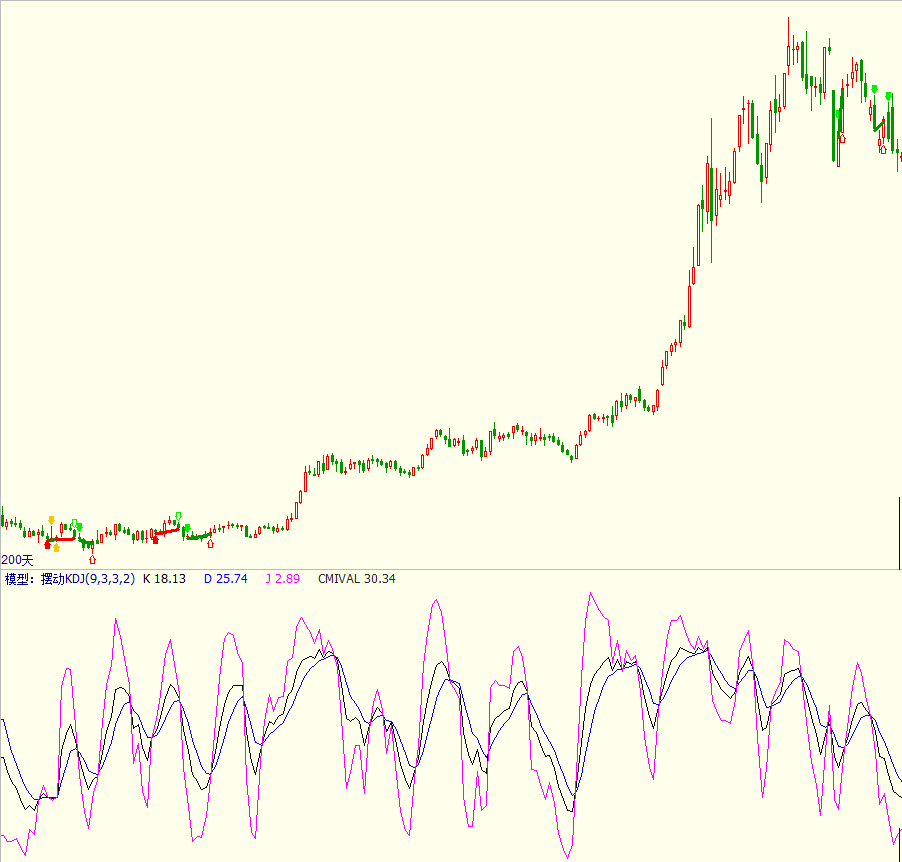
- The KDJ random indicator consists of three lines K, D, J. The indicator line varies between 0 and 100, the J line is below 20, enters the oversold zone, the J line is above 80, enters the overbought zone.
RSV:=(CLOSE-LLV(LOW,N))/(HHV(HIGH,N)-LLV(LOW,N))*100;
//收盘价与N周期最低值做差,N周期最高值与N周期最低值做差,两差之间做比值。
K:SMA(RSV,M1,1);//RSV的移动平均值
D:SMA(K,M2,1);//K的移动平均值
J:3*K-2*D;
BACKGROUNDSTYLE(1);
CROSS(K,D),BPK;//KD金叉,做多。
CROSS(J,20),BP;//J值上穿20
CROSS(D,K),SPK;//KD死叉,做空。
CROSS(80,J),SP;// J值下穿80
AUTOFILTER;
- The MACD is a smooth asymmetrical moving average derived from a binary moving average, which is a fast moving average minus a slow moving average. The meaning of MACD is essentially the same as that of a binary moving average.
DIFF:EMA(CLOSE,12) - EMA(CLOSE,26);
//短周期与长周期的收盘价的指数平滑移动平均值做差。
DEA:EMA(DIFF,9);//DIFF的M个周期指数平滑移动平均
2*(DIFF-DEA),COLORSTICK;//DIFF减DEA的2倍画柱状线
CROSS(DIFF,DEA),BPK;//DIFF上穿DEA,做多。
CROSS(DEA,DIFF),SPK;//DIFF下穿DEA,做空。
AUTOFILTER;
The cross-indicator model case
Why are we crossing the line?
-
The first reason: cross indicators in the model, a trading idea that resonates with the internal elements of the technical side, combining several different classification indicator trading ideas together to make a look.
-
The second reason is that trend indicators fail in the market as a whole, and the use of oscillators alone cannot determine the current state of the market, requiring multiple indicators combined analysis.
Thinking often
- The trend-judgement is combined with a meticulous analysis.
- Many conditions are the same as judging.
Examples of shock models
- The Tide Index
ABS(CLOSE-REF(CLOSE,29))/(HHV(HIGH,30)-LLV(LOW,30))*100
Measures price fluctuations over a period of time: the index fluctuates continuously within a small range, indicating that the market is in a bull market, otherwise it is a trend market.
Shock model trading ideas: Tide index judgments, KDJ swing indicators to find entry and exit points
This model can be written like this:
RSV:=(CLOSE-LLV(LOW,N))/(HHV(HIGH,N)-LLV(LOW,N))*100;
K:SMA(RSV,M1,1);//RSV的移动平均值
D:SMA(K,M2,1);//K的移动平均值
J:3*K-2*D;
CMIVAL:ABS(CLOSE-REF(CLOSE,29))/(HHV(HIGH,30)-LLV(LOW,30))*100,NODRAW;
BACKGROUNDSTYLE(1);
K>D&&EVERY(CMIVAL<20,2),BPK;//盘整行情,KD金叉,做多。
CROSS(J,10)||CROSS(K,D),BP;// J值上穿10超卖或者KD金叉,平仓
D>K&&EVERY(CMIVAL<20,2),SPK;//盘整行情,KD死叉,做空。
CROSS(90,J)||CROSS(D,K),SP;// J值下穿90超买或者KD死叉,平仓
AUTOFILTER;
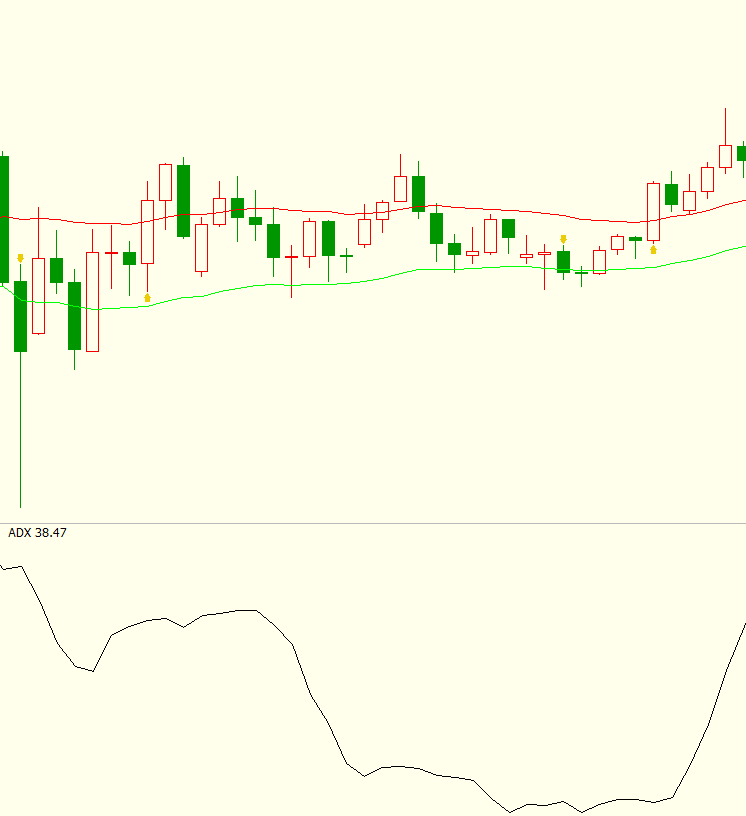
Examples of trend models
Trend model trading thinking: The EMA determines whether the trend is up or down; the ADX indicator reflects the degree of change in the trend, the strong entry of the trend and the weak outlook of the trend.
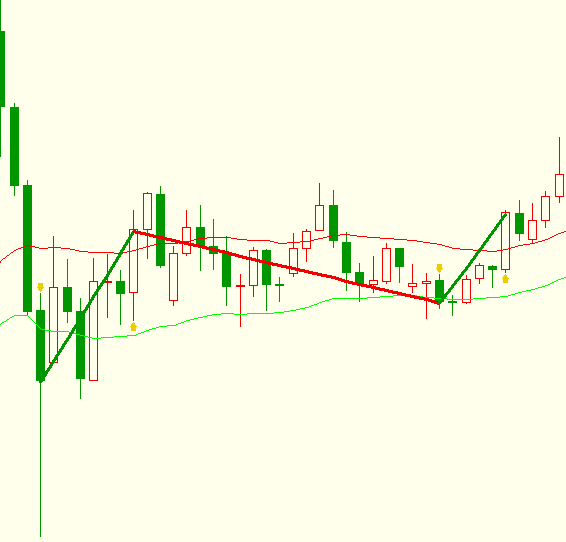
The EMA's trend judgement of the trading system:
UPPERMA:EMA(HIGH,30);//计算30根K线最高价的EMA
LOWERMA:EMA(LOW,30);//计算30根K线最低价的EMA
CROSSUP(C,UPPERMA),BPK;//收盘价上穿EMA,做多
CROSSDOWN(C,LOWERMA),SPK;//收盘价下穿EMA,做空
AUTOFILTER;
The EMA can only judge a multi-trend and a short-trend, but cannot judge the strength or weakness of the trend, so the EMA fails in the market's setup, so we need to look for an indicator that can reflect a strong or weak trend: the ADX index.
The code is as follows:
TR:=SUM(MAX(MAX(HIGH-LOW,ABS(HIGH-REF(CLOSE,1))),ABS(LOW-REF(CLOSE,1))),14);
HD:=HIGH-REF(HIGH,1);//最高价与前一周期最高价做差
LD:=REF(LOW,1)-LOW;//前一周期最低价与最低价做差
DMP:=SUM(IFELSE(HD>0 && HD>LD,HD,0),14);
//如果HD>0并且HD>LD,取HD否则取0,对取值做N周期累加求和。
DMM:=SUM(IFELSE(LD>0 && LD>HD,LD,0),14);
//如果LD>0并且LD>HD,取LD否则取0,对取值做N周期累加求和。
PDI:=DMP*100/TR;
MDI:=DMM*100/TR;
ADX:=MA(ABS(MDI-PDI)/(MDI+PDI)*100,6);
The ADX indicates a strong uptrend and the ADX indicates a weak downtrend.
We then combine the two to form a trading system based on ADX and EMA.
The code is as follows:
TR:=SUM(MAX(MAX(HIGH-LOW,ABS(HIGH-REF(CLOSE,1))),ABS(LOW-REF(CLOSE,1))),14);
HD:=HIGH-REF(HIGH,1);
LD:=REF(LOW,1)-LOW;
DMP:=SUM(IFELSE(HD>0 && HD>LD,HD,0),14);
DMM:=SUM(IFELSE(LD>0 && LD>HD,LD,0),14);
PDI:=DMP*100/TR;
MDI:=DMM*100/TR;
ADX:=MA(ABS(MDI-PDI)/(MDI+PDI)*100,6);
UPPERMA:=EMA(HIGH,30);
LOWERMA:=EMA(LOW,30);
CROSSUP(C,UPPERMA)&&EVERY(ADX>REF(ADX,1),2),BPK;
//当ADX连续两周期向上且当前价大于30根K线最高价的EMA满足买入条件
CROSSDOWN(C,LOWERMA)&&EVERY(ADX>REF(ADX,1),2),SPK;
//当ADX连续两周期向上且当前价下于30根K线最低价的EMA满足卖出条件
AUTOFILTER;
Multiple homogeneous indicators are judged in the same direction Increase your chances of winning with accurate analysis
Look for multiple trend indicators: Boll (Boll) channel, Dong-Chian channel, or linear dynamic breakthrough system based on adaptive Boll channel and adaptive Dong-Chian channel
Donchian channel: invented by Richard Dennis, a physicist in the American futures market and the precursor to the law of the sea. It is made up of the highest and lowest prices in a certain cycle (generally 20, set as changeable in cases) that form up and down tracks. When the price breaks the up-down trajectory, the breakout is a possible buy signal; conversely, the breakout is a possible sell signal.
The idea of multi-indicator trading model:
-
Yesterday, the price was higher than the price of the Brin tunnel, and the price of the cycle that day was higher than the price of the Dongcheng tunnel, which is more expensive.
-
Yesterday, the price was lower than the Brin tunnel, and the price of the cycle was lower than the Dongguan tunnel, opening a blank order.
-
When holding multiple orders, the price is less than the adjusted average, and the price is cheaper.
-
When holding a blank order, the price is higher than the adjusted average line, flat blank order
We can write it like this:
//当日市场波动
TODAYVOLATILITY:=STD(CLOSE,30);
//昨日市场波动
YESTERDAYVOLATILITY:=REF(TODAYVOLATILITY,1);
//市场波动的变动率
DELTAVOLATILITY:(TODAYVOLATILITY-YESTERDAYVOLATILITY)/TODAYVOLATILITY;
//计算自适应参数
LOOKBACKDAYS1:=LOOP2(BARPOS=30,20,REF(LOOKBACKDAYS1,1)*(1+DELTAVOLATILITY));
LOOKBACKDAYS2:=ROUND(LOOKBACKDAYS1,0);
LOOKBACKDAYS3:=MIN(LOOKBACKDAYS2,60);//60自适应参数的上限
LOOKBACKDAYS:=MAX(LOOKBACKDAYS3,20);//20自适应参数的下限
//自适应布林通道中轨
MIDLINE:=MA(CLOSE,LOOKBACKDAYS);
BAND:=STD(CLOSE,LOOKBACKDAYS);
//自适应布林通道上轨
UPBAND:=MIDLINE+2*BAND;
//自适应布林通道下轨
DNBAND:=MIDLINE-2*BAND;
//自适应唐奇安通道上轨
BUYPOINT:=HHV(HIGH,LOOKBACKDAYS);
//自适应唐奇安通道下轨
SELLPOINT:=LLV(LOW,LOOKBACKDAYS);
//自适应出场均线
LIQPOINT:=MIDLINE;
//昨日价格大于布林通道上轨,并且当日价格大于唐奇安通道上轨,开多单
REF(C,1)>REF(UPBAND,1)&&HIGH>=REF(BUYPOINT,1),BK;
//持有多单时,昨日价格小于布林通道下轨,并且当日价格小于唐奇安通道下轨,平多单
REF(C,1)<REF(DNBAND,1)&&LOW<=REF(SELLPOINT,1),SP;
//持有多单时,价格小于自适应出场均线,平多单
BARSBK>=1&&LOW<=REF(LIQPOINT,1),SP;
//持有空单时,昨日价格大于布林通道上轨,并且当日价格大于唐奇安通道上轨,平空单
REF(C,1)>REF(UPBAND,1)&&H>=REF(BUYPOINT,1),BP;
//昨日价格小于布林通道下轨,并且当日价格小于唐奇安通道下轨,开空单
REF(CLOSE,1)<REF(DNBAND,1)&&LOW<=REF(SELLPOINT,1),SK;
//持有空单时,价格大于自适应出场均线,平空单
BARSSK>=1&&HIGH>=REF(LIQPOINT,1),BP;
AUTOFILTER;
During the writing process, it is important to note that in the My language, the CROSSUP key, the CROSSDOWN key and the > key, the difference between the < key, and the flexible use of the AND & & key, the multi-conditional connection operator to pay attention to the priority issue. There is also the key: the difference between the > key and the = key. Finally, the same variables and parameters are modified.
As you can see, My language is a very powerful scripting language, in addition to a friendly beginner learning experience, even a quantitative pro can flexibly use a combination of these indicators and grammar to create powerful trading strategies, with the excellent support of the API interface of the inventor's quantitative platform, the quantitative developers can finally really put all their energy on the research and writing of strategies, instead of using the underlying architecture of the trading system that has nothing to do with quantitative trading, especially these years restrictions on high-frequency trading are increasingly strict, both for digital currencies and for the domestic commodity market.
- OKX websocket issue
- Strategy framework templates are not for empty trades
- Inventors quantify new feature "Send commands to WeChat/WeChat control disks"
- OKEX is currently undergoing a hedging strategy that suggests a leverage Only support CTP leverage
- How to get a deal (paid)
- with IO, returns 4:invalid character
- How to get an array of a price in pyhon instead of an array of Record
- Writing group instructions in a quantitative trading strategy
- Failed to read exchanges_list
- Writing my language's cross-cycle model
- I have a question about trading strategies, is there any easy way to answer?
- The two-day feedback system was a bit stuck, what's the problem?
- Macd is off the code.
- Is there a way to tell if HttpQuery returns a failure?
- OKV3接口,如何用exchange.IO调用
- I asked for directions, not knowing where to go wrong.
- One-sided grid of the grid deformation policy (annotation version) Problems with the grid in the real disk operation failed to obtain order information
- Repeat, please tell me about the exchange.GetDepth ((() to get the amount of market depth, is it meaningless?
- Please teach me about the IO function error reporting problem.
- OKEX期货回测时,不支持exchange.GetPosition吗?
gyp9What is it?
wwq4817That's good.