Seven regression techniques you should master
Author: The Little Dream, Created: 2016-12-18 10:22:43, Updated: 2016-12-18 11:08:56Seven regression techniques you should master
This article explains regression analysis and its advantages, focusing on the seven most common regression techniques to be mastered: linear regression, logical regression, polynomial regression, stepwise regression, tangent regression, query regression, ElasticNet regression, and their key elements, and finally introduces the key factors for choosing the right regression model. ** ** This article explains the implications of regression analysis and its advantages, focusing on the seven most common regression techniques to be mastered: linear regression, logical regression, polynomial regression, stepwise regression, loop regression, query regression, ElasticNet regression, and their key elements. Finally, the key factors for choosing the right regression model are presented.
-
What is regression analysis?
Regression analysis is a predictive modeling technique that studies the relationship between the cause variable (target) and the self variable (predictor). This technique is often used in predictive analysis, time sequence models, and the causal relationship between the detected variables. For example, the relationship between driver reckless driving and the number of road traffic accidents is best studied by regression.
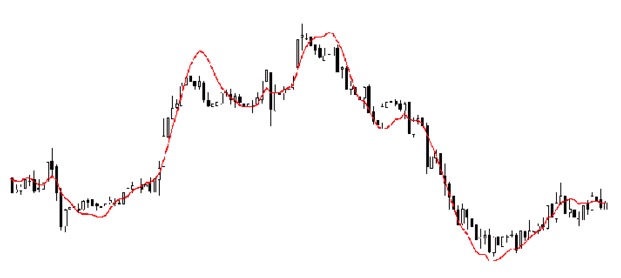
Regression analysis is an important tool for modeling and analyzing data. Here, we use curves/lines to match these data points, in this way, the distance difference from the curve or line to the data point is minimal. I will explain this in detail in the next section.
-
Why do we use regression analysis?
As mentioned above, regression analysis estimates the relationship between two or more variables. Below, let's give a simple example to understand it:
For example, in the current economic conditions, you want to estimate the sales growth of a company. Now, you have the latest data from the company, which shows that sales growth is about 2.5 times that of economic growth. Then using regression analysis, we can predict the future sales of the company based on current and past information.
There are many benefits to using regression analysis; specifically:
It shows a significant relationship between the independent variable and the dependent variable.
It indicates the intensity of the effect of multiple independent variables on a given variable.
Regression analysis also allows us to compare the interactions between variables that measure different scales, such as the relationship between price changes and the number of promotional activities. These help market researchers, data analysts, and data scientists to exclude and estimate the best set of variables to build predictive models.
-
How many regression technologies do we have?
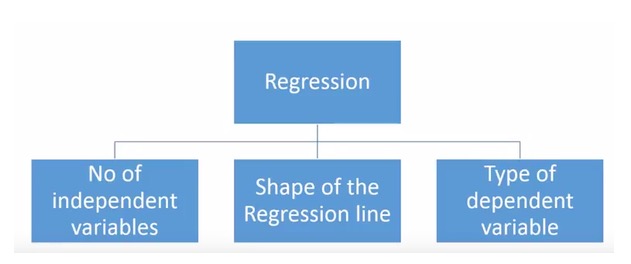
There are a wide variety of regression techniques used for forecasting. These techniques have three main metrics (number of self-variables, type of variable, and shape of the regression line). We will discuss them in detail in the sections below.
For those who are creative, you can even create an unused regression model if you feel it is necessary to use a combination of the above parameters.
-
1. Linear Regression
It is one of the most well-known modeling techniques. Linear regression is often one of the preferred techniques when learning predictive models. In this technique, since the variables are continuous, the independent variables can be continuous or discrete, and the nature of the regression line is linear.
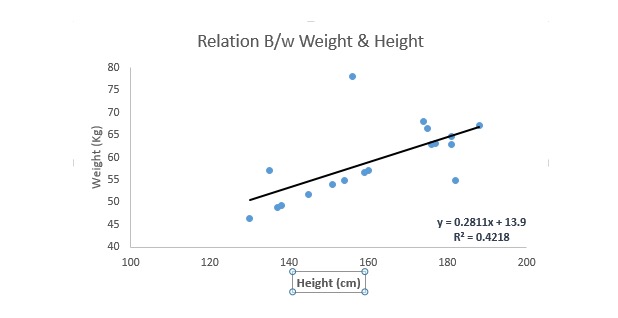
Linear regression uses a best fit line (i.e. a regression line) to establish a relationship between the dependent variable (Y) and one or more independent variables (X).
It is represented by an equation, i.e. Y = a + b * X + e, where a denotes the intersection, b denotes the slope of the line, and e is the error term. This equation can predict the value of the target variable based on given prediction variables (s).
The difference between a monolinear regression and a multilinear regression is that a multilinear regression has < 1 self-variable, whereas a monolinear regression usually has only one self-variable. The question now is how do we get an optimal matching line?
How to get the best fit line (a and b)?
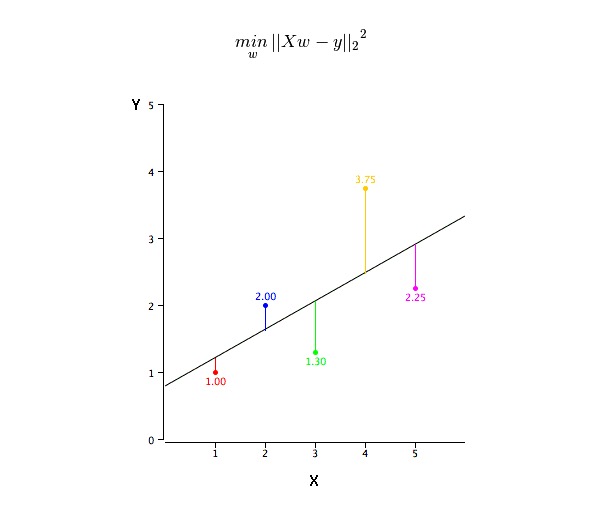
This problem can be easily solved using the least squares method. The least squares method is also the most commonly used method for matching regression lines. For observational data, it calculates the optimal matching line by minimizing the sum of the squares of the vertical deviations of each data point to the line.
We can use R-square indicators to evaluate model performance. For more information on these indicators, read: Model Performance Indicators Part 1, Part 2.
The point:
- A linear relationship must exist between the independent variable and the dependent variable
- Multigeneous regression has multiple covalent, self-correlation and heterogeneous differences.
- Linear regression is very sensitive to abnormal values. It can severely affect the line of regression and ultimately affect the predicted value.
- Multilinearity increases the variance of the coefficient estimate, making the estimate very sensitive to slight changes in the model. The result is that the coefficient estimate is unstable.
- In the case of multiple eigenvalues, we can use forward selection, backward elimination, and incremental filtering to select the most important eigenvalues.
-
2. Logistic Regression
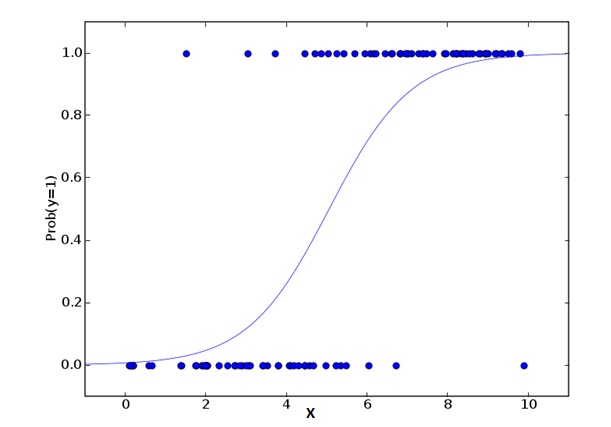
Logical regression is used to calculate the probability of a Y-event = Success Y and a Y-event = Failure Y. When the type of the given variable is binary ((1/0, true/false, yes/no) variables, we should use logical regression. Here, the value of Y is from 0 to 1, which can be expressed by the following equation.
odds= p/ (1-p) = probability of event occurrence / probability of not event occurrence
ln(odds) = ln(p/(1-p))
logit(p) = ln(p/(1-p)) = b0+b1X1+b2X2+b3X3....+bkXk
In the above formula, the expression p has a probability of some characteristic. You should ask a question like this: Why do we use logarithms in the formula?
Because we are using a binary distribution (due to variables) here, we need to select a connecting function that is best for this distribution. It is the Logit function. In the above equation, the parameters are selected by observing the highly similar estimates of the sample, rather than minimizing squares and errors (as used in ordinary regression).
The point:
- It is widely used in classification problems.
- Logical regression does not require that the independent variable and the dependent variable be linear relationships. It can handle relationships of all types because it uses a nonlinear log transformation for the predicted relative risk index OR.
- In order to avoid over- and under-fitting, we should include all the important variables. A good way to ensure this is to use stepwise screening to estimate the logical regression.
- It requires large sample sizes, because in the case of small sample sizes, the very similarly estimated effect is two-fold worse than the usual minimum.
- Since the variables should not be interrelated, i.e. not have multiple covalent linearities; however, in analysis and modeling, we can choose to include the effects of the interaction of the classified variables.
- If the value of the dependent variable is an ordered variable, it is called order logical regression.
- If a given variable is polynomial, it is called a polynomial logical regression.
-
3. Polynomial Regression is a polynomial regression
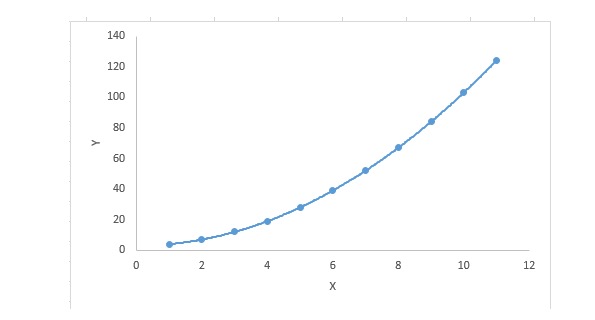
For a regression equation, if the index of the independent variable is greater than 1, then it is a polynomial regression equation.
y=a+b*x^2In this regression technique, the best fit line is not a straight line; it is a curve used to fit data points.
The focus:
- While there will be an induction to fit a high-order polynomial and get a lower error, this can lead to overfitting. You need to draw a relationship chart often to see the fit and focus on ensuring that the fit is reasonable, with neither overfitting nor underfitting. Here is an example to help understand:
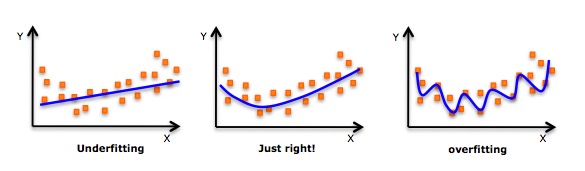
- Obviously look for curve points at both ends to see if these shapes and trends make sense. Higher-order polynomials may end up producing strange inferences.
-
Stepwise Regression 4.
In this technique, the selection of the self-variable is done in an automated process, which includes non-human operations.
This feat is to identify important variables by observing statistical values such as R-square, t-stats, and AIC indicators. Stepwise regression fits the model by simultaneously adding/removing covariates based on specified criteria. Here are some of the most common stepwise regression methods:
- The standard stepwise regression method does two things. It adds and removes the predictions required for each step.
- Forward selection starts with the most significant prediction in the model and then adds variables for each step.
- Backward exclusion starts with all predictions of the model at the same time, then eliminates the least significant variable at each step.
- The goal of this modeling technique is to maximize predictive power with the least number of predictive variables; this is also one of the ways to handle high-dimensional datasets.
-
Ridge Regression Returns 5.
Oval regression analysis is a technique used for the existence of multiple convex (highly correlated with the variable) data. In the case of multiple convex (highly correlated with the variable), the standard error is reduced by adding a deviation to the estimate of the regression, although the minimum binomial (OLS) is fair for each variable, but their differences are so large that the observed value deviates and is far from the true value.
Above, we see the linear regression equation. Remember? It can be expressed as:
y=a+ b*xThis equation also has an error term. The complete equation is:
y=a+b*x+e (error term),  [error term is the value needed to correct for a prediction error between the observed and predicted value]
=> y=a+y= a+ b1x1+ b2x2+....+e, for multiple independent variables.
In a linear equation, the prediction error can be broken down into two subfractions. One is the deviation and the other is the difference. The prediction error may be caused by either of these fractions or by either of them. Here we will discuss the related errors caused by the difference.
Solve the multi-linearity problem by using the regression curve λ ((lambda)). See the formula below.

In this formula, there are two components. The first is the smallest binomial, the other is the times λ of β2 ((β-square), where β is the corresponding coefficient. Add it to the smallest binomial to get a very low differential.
The point:
- Except for the constant terms, this regression assumption is similar to the minimum two-fold regression.
- It shrinks the values of the corresponding coefficients, but does not reach zero, which indicates that it has no feature selection function.
- This is a regularization method and uses L2 regularization.
-
Lasso Regression regression
It is similar to regression to the Lasso (Least Absolute Shrinkage and Selection Operator), which also penalizes the absolute size of the regression coefficient. In addition, it can reduce the degree of variation and improve the accuracy of the linear regression model. See the formula below:

Lasso regression differs slightly from Ridge regression in that it uses a penalty function that is an absolute value, not a square. This results in a penalty (or the sum of the absolute values of the constraint estimates) that results in some parameter estimates being equal to zero. The larger the penalty value, the further the estimate is used, and the shrinkage is closer to zero. This will result in us choosing a variable from a given n variables.
The point:
- Except for the constant terms, this regression assumption is similar to the minimum two-fold regression.
- It has a shrinkage coefficient close to zero (equal to zero), which does help with feature selection.
- This is a normalization method that uses L1 normalization.
- If a set of predicted variables is highly relevant, Lasso selects one of the variables and reduces the others to zero.
-
7.ElasticNet回归
ElasticNet is a hybrid of Lasso and Ridge regression techniques. It uses L1 to train and L2 to prioritize as a normalization matrix. ElasticNet is useful when there are multiple related features. Lasso will randomly select one of them, while ElasticNet will select two.

The practical advantage between Lasso and the Ridge is that it allows ElasticNet to inherit some of the stability of the Ridge in the loop state.
The point:
- In the case of highly correlated variables, it produces a group effect;
- There is no limit to the number of variables that can be selected.
- It can withstand double shrinkage.
- In addition to these 7 most commonly used regression techniques, you can also look at other models such as Bayesian, Ecological and Robust regression.
-
How to choose the right regression model?
Life is often simple when you only know one or two techniques. I know a training organization that told their students to use linear regression if the result is continuous. If it is binary, use logical regression!
In a multi-class regression model, it is important to choose the most appropriate technique based on the type of self-variable and dependent variable, the dimensions of the data, and other basic characteristics of the data. Here are the key factors for choosing the right regression model:
Data exploration is an inevitable part of building a predictive model. It should be the first step in choosing the right model, such as identifying the relationships and effects of variables.
The advantages of different models are that we can analyze different indicator parameters such as parameters of statistical significance, R-square, Adjusted R-square, AIC, BIC and error terms, another being the Mallows cube Cp guideline. This is mainly done by comparing the model with all possible sub-models (or selecting them carefully) and checking for possible deviations in your model.
Cross-validation is the best way to evaluate the prediction model. Here, divide your data set into two parts (one for training and one for verification) and use a simple mean difference between the observed and predicted values to measure the accuracy of your prediction.
If your dataset is multiple mixed variables, then you should not choose the automatic model selection method, because you should not want to put all the variables in the same model at the same time.
It will also depend on your purpose. There may be situations where a less robust model is easier to implement than a model with a high statistical significance.
Regression normalization methods (Lasso, Ridge, and ElasticNet) work well in cases of multiple con-linearities between high-dimensional and dataset variables.
-
Translated from CSDN
- Why slippage occurs in programmatic transactions
- The core of money management -- the choice of leverage
- Financial knowledge
- Causes and uses of ionization rates
- What are the advantages of leveraged trading?
- Here are 20 questions you didn't know about futures trading tips!
- Robots often report mistakes and disconnect
- How do traders sell off risk?
- Robots are getting information that is often wrong, is there a good solution?
- The least common multiple of the linear regression theorem
- Gauss and the Black Swan
- The Bretton Woods system
- Which god can help me write a simple strategy?
- Chasing the Girl and Finding the Missile, the statistical formula of Bob Bees
- Is the Bitcoin spot trading platform without idle and leverage application functionality?
- I'm going to tell you a few simple, easy-to-understand stories about statistics.
- Can quantitative trading be modularised to make it easier to get in?
- The top 10 secrets that a good cook can't tell
- The price strategy of the Fiat 4
- Interesting quantitative short stories - multiple heads and blank heads