How do you use HighChart to map areas?
Author: [Translated from Chinese], Created: 2021-11-26 06:13:48, Updated:The Effect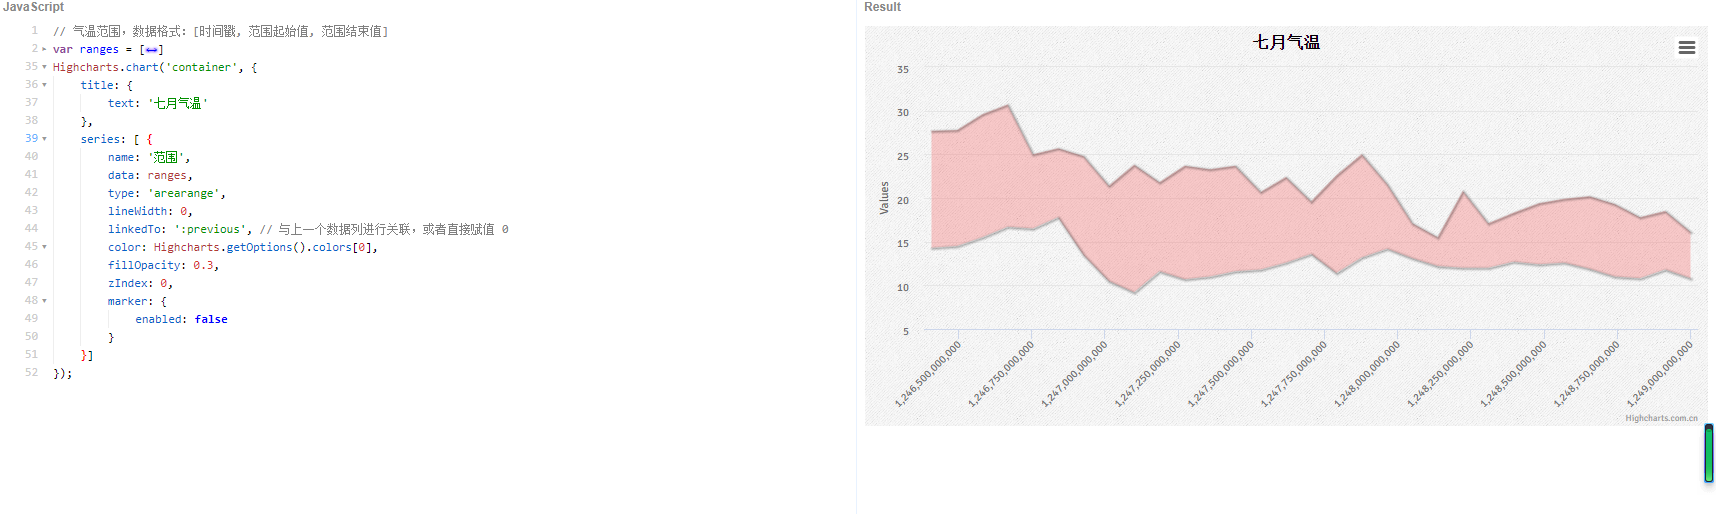 Here's a graph I added with jS.
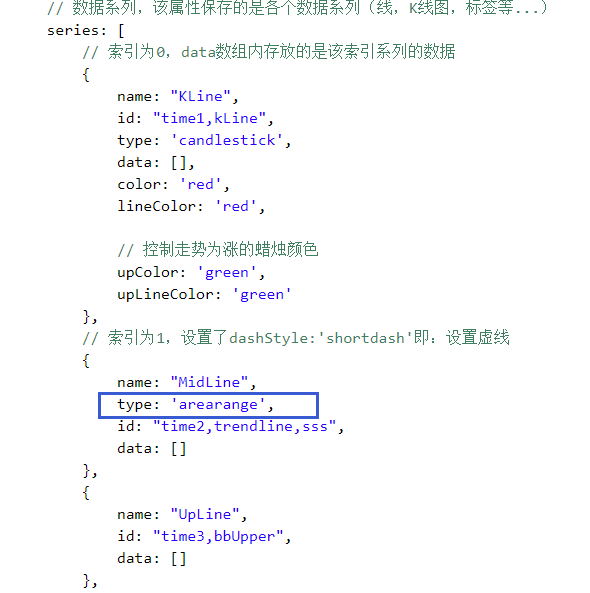 If the type='areaerange array policy is annotated, the K-string graph can be printed normally, but if the subsequent policy graph is added, it cannot be displayed
Is the high chart version of fmz not supported?
This is my method of adding, add0 and add3 are both possible, add1 doesn't show a blank whether it's an annotated or an annotated policy icon.
If the type='areaerange array policy is annotated, the K-string graph can be printed normally, but if the subsequent policy graph is added, it cannot be displayed
Is the high chart version of fmz not supported?
This is my method of adding, add0 and add3 are both possible, add1 doesn't show a blank whether it's an annotated or an annotated policy icon.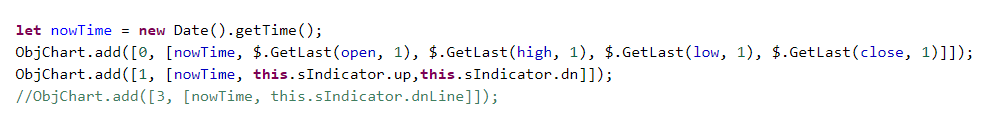
More
- Hanging an order When the order is completed printing the proceeds
- Seeking help with platform data source issues
- External data source cannot be called
- The feasibility of a long-term contract capital rate return
- Please tell me how to use try in python if this error occurs, except
- Problems with k-line accumulation
- My real disk went in and said: I can't find it.
- Is FMZ charged?
- The alarm clock. The BP signal is coming but it is not executing.
- GetRecords: timeout: Do you need to restart the hard drive?
- Ask for help, what's wrong with this tip?
- Ask for help, ok futures, my language how to write a permanent contract
- The OTEX interface update is announced
- The Mayan language tactic is implemented always with error reporting, holding the reverse contract to stop running.
- Mac os locally retrieves error reports
- What do these arrows mean when they are retested?
- Access to order information
- Questions about GetRecords
- I'd like to ask how multi-currency strategies work when you're dealing with multiple threads, and sometimes it's not possible to switch to a new currency without switching back.
- Coin contract variety subscription failed
[Translated from Chinese]highChart example link: https://jshare.com.cn/demos/hhhhDr?hc-theme=sand-signika