Inventors quantified the PINE language introductory tutorial
Author: The Little Dream, Created: 2022-05-30 16:23:43, Updated: 2022-09-28 17:10:21[TOC]
Inventors quantified the PINE language introductory tutorial
The video is accompanied by a tutorial:Quantifying trading is too difficult to get started? Using trading view Pine language from small white to Quant God - Pine language beginner explorer
The Inventor Quantitative Trading Platform supports the writing of policies in the Pine language, supporting retrieval, real-time running of policies in the Pine language, and is compatible with lower versions of the Pine language.FMZ.COM(See also:Strategy SquareIt has a number of Pine policies (scripts) for searching and porting.
FMZ not only supports the Pine language, but also supports the powerful graphics functionality of the Pine language. The features of the FMZ platform, rich in useful tools, efficient and easy management, also further enhance the usability of the Pine policy (script). FMZ is based on the compatibility of the Pine language, but also has some extensions, optimizations and cropping of the Pine language.
A brief overview of some of the more obvious differences:
-
1, Pine policy on FMZ, version identifier at the beginning of code
//@versionIt starts with code.strategy、indicatorThe statement does not require writing, FMZ does not support it for nowimportImportedlibraryThe function of the.You might see some of the strategies written like this:
//@version=5
indicator("My Script", overlay = true)
src = close
a = ta.sma(src, 5)
b = ta.sma(src, 50)
c = ta.cross(a, b)
plot(a, color = color.blue)
plot(b, color = color.black)
plotshape(c, color = color.red)
Or it reads like this:
//@version=5
strategy("My Strategy", overlay=true)

longCondition = ta.crossover(ta.sma(close, 14), ta.sma(close, 28))
if (longCondition)
    strategy.entry("My Long Entry Id", strategy.long)

shortCondition = ta.crossunder(ta.sma(close, 14), ta.sma(close, 28))
if (shortCondition)
    strategy.entry("My Short Entry Id", strategy.short)
On FMZ, it can be simplified to:
src = close
a = ta.sma(src, 5)
b = ta.sma(src, 50)
c = ta.cross(a, b)
plot(a, color = color.blue, overlay=true)
plot(b, color = color.black, overlay=true)
plotshape(c, color = color.red, overlay=true)
Or:
longCondition = ta.crossover(ta.sma(close, 14), ta.sma(close, 28)) if (longCondition) strategy.entry("My Long Entry Id", strategy.long) shortCondition = ta.crossunder(ta.sma(close, 14), ta.sma(close, 28)) if (shortCondition) strategy.entry("My Short Entry Id", strategy.short) -
2, Policy (script) Some transaction-related settings are set by the "Pine language transaction library" parameter on the FMZ policy interface.
-
Closing price model and real-time price model In the trading view, we can go through
strategyof the functioncalc_on_every_tickParameters to set strategy scripts to execute strategy logic in real-time each time price changes, at which pointcalc_on_every_tickThe parameters should be set totrue❖ By defaultcalc_on_every_tickThe parameters arefalseThis is the time when the current K-line BAR of the strategy is completely gone. In FMZ, the parameters of the "Pine Language Exchange Library" template are set.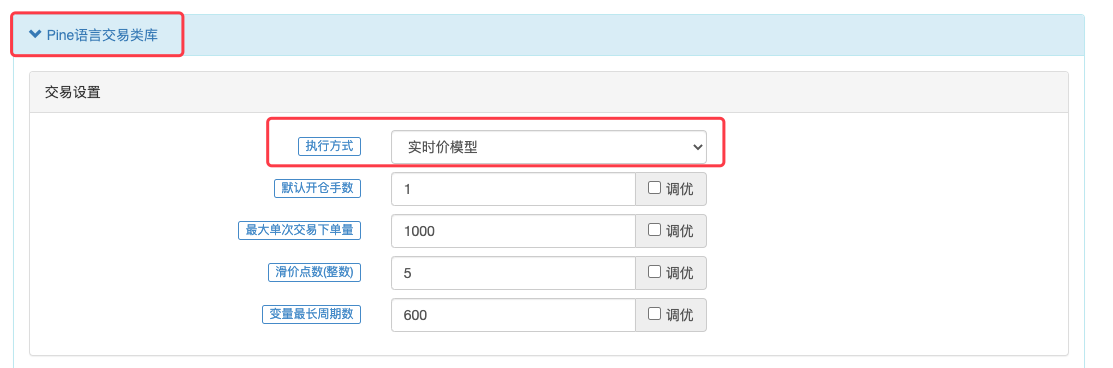
-
Numerical precision controls such as price, order quantity when the strategy is executed need to be specified on the FMZ In the trading view, there is no real-time order accuracy problem because only simulated tests can be performed. In the FMZ, the Pine strategy can be run in real time. Then the strategy needs to be able to flexibly specify the price accuracy of the trade variety, the order quantity accuracy. These precision settings control the small number of digits of the relevant data to avoid data that does not meet the requirements of the exchange listing and therefore cannot place an order.
-
The code of the futures contract In the FMZ, the trading varieties have two properties if they are contracts. They are "trade pairs" and "contract codes" respectively. In addition to the need to explicitly set the trading pairs on the physical disk and in retrospect, specific contract codes need to be set in the parameter "breed code" of the "Pine language trade library" template.
swapThe contract code depends on whether the exchange that operates the exchange has such a contract. For example, some transactions have all-quarter contracts, which can be filled in herequarterThe contract codes are consistent with the futures contract codes defined in FMZ's JavaScript/python/c++ language API documentation.
For other settings, such as minimum subset, default subset, etc., see the Pine language documentation for details."Pine language exchange library"The parameters are presented here.
-
-
3、
runtime.debug、runtime.log、runtime.errorFMZ extended functions for debugging.The FMZ platform adds three functions for debugging.
-
runtime.debug: print variable information on the controller, generally not used for this function. -
runtime.log: output the contents in the log. ⇒ FMZ PINE language has a special function. ⇒ FMZ PINE language has a special function. ⇒ FMZ PINE language has a special function. ⇒ FMZ PINE language has a special function. ⇒ FMZ PINE language has a special function. ⇒ FMZ PINE language has a special function. ⇒ FMZ PINE language has a special function. ⇒ FMZ PINE language has a special function. ⇒ FMZ PINE language has a special function.runtime.log(1, 2, 3, close, high, ...),可以传多个参数。 -
runtime.error: When called, it causes runtime errors and carries the error message specified in the message parameter.runtime.error(message)
-
-
4, partially extended in the graph function
overlayParametersPine language on FMZ, drawing graph function
plot、plotshape、plotcharand so on.overlayParameter support, allowing to specify a picture in the main or sub-picture.overlaySet uptrueDrawing in the main diagram, set tofalseDrawing in subgraphs. Enable the Pine policy on FMZ to draw both subgraphs and themes at the same time. -
5、
syminfo.mintickValuation of the built-in variablesyminfo.mintickThe built-in variable is defined as the minimum set point value of the current variety; in FMZThe real thing/ReassessmentThe template parameter in the "Pine language trading library" on the interface allows you to control the value of the pricing currency accuracy. The pricing currency accuracy setting of 2 means that the price is accurate to the second decimal place when trading, at which point the minimum unit of change of the price is 0.01.syminfo.mintickThe value is 0.01//. -
6. The average price in FMZ PINE Script is the price that includes the service fee
For example: the price of the order is 8000, the direction of sale, the number of hands (one), the average price after the transaction is not 8000, less than 8000 (the cost includes the handling fee).
Base of the Pine language
When starting to learn the basics of the Pine language, we may not be familiar with some of the instructions and code syntax in the examples. It doesn't matter if we don't understand, we can get familiar with the concept first, understand the purpose of the test, or consult FMZ's Pine language documentation for instructions. Then follow the tutorial step by step to gradually become familiar with various syntax, instructions, functions, built-in variables.
Model execution
It is very necessary to understand the related concepts such as the execution process of the Pine language scripting language when learning the Pine language. The Pine language strategy is a chart-based operation, which can be understood as a series of calculations and operations that are executed on a chart in chronological order from the earliest data already loaded on the chart. The initial load of the chart is limited.bar_indexIt refers to the index value of the current K-lineBar at the time of execution of the Pine script.
plot(bar_index, "bar_index")
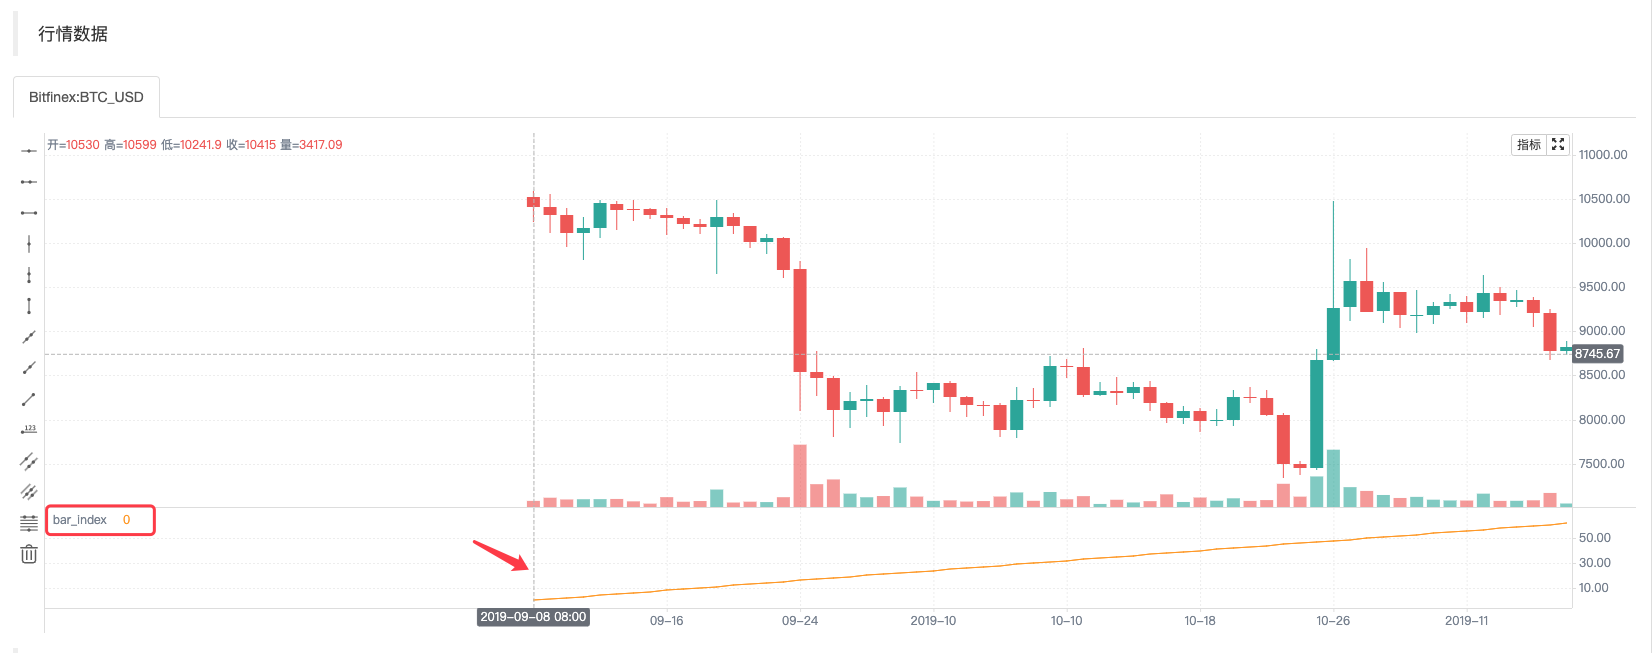
plotThe function is one of the most common functions we will use in the future. Its use is simple, it draws a line on a graph according to the input parameters, the input data isbar_indexThe line is namedbar_indexYou can see that the value of the line called bar_index in the first Bar name is 0, and the value of the line is increased by 1 as Bar increases to the right.
Depending on the setup of the strategy, the execution model of the strategy also differs.收盘价模型and实时价模型The concept of the closing price model, the real-time price model, has been briefly introduced before.
-
The closing model
When the strategy code is executed, the cycle of the current K-line Bar is fully executed, and the K-line cycle is over when the K-line closes. At this time, the Pine strategy logic is executed again, and the triggered trading signal is executed at the beginning of the next K-line Bar.
-
Real-time pricing model
When the strategy code is executed, the current K-line Bar is executed repeatedly on each change in the market, whether it is closed or not, and the triggered trading signal is executed immediately.
When the Pine language policy is executed from left to right on a graph, the K-lineBar on the graph is divided into历史Barand实时BarThis is a very sad story.
-
The History Bar
When the policy is set to "True Price Model", all of the K-line bars on the chart except for the one on the far right side of the chart are set to "True Price Model".
历史Bar◎ Strategic logic in every corner历史BarIt can only be executed once. When the policy is set to "Close Price Model", all the bars on the chart are历史Bar◎ Strategic logic in every corner历史BarIt can only be performed once.Calculations based on historical Bar: The policy code is executed once in the closed state of the History Bar, and then the policy code continues to be executed in the next History Bar until all of the History Bar are executed once.
-
Bar in real time
When the policy is executed on the last K-line Bar on the far right, the Bar is called a Real-time Bar. When the Real-time Bar is closed, the Bar becomes a past Real-time Bar (turned into a History Bar). The rightmost side of the chart generates a new Real-time Bar.
When the strategy is set to "real-time price model", the strategy logic is executed once for every market change on the real-time Bar. When the policy is set to "Close Price Model", the chart does not show real-time Bar when it starts executing.
Based on real-time Bar calculations: If the strategy is set to "Close Price Model" and the chart does not show real-time Bar, the policy code is executed only once at the current Bar close. If the policy is set to "real-time price model", the calculation on the real-time Bar is completely different from the historical Bar, which executes one policy code for each market change on the real-time Bar; for example, a built-in variable.
high、low、closeIn the historical Bar, these values are fixed, and in the real-time Bar, they may change every time a transaction changes. So data such as indicators based on these values are also changing in real-time. In the real-time Bar, these values may change every time a market changes.closeIt is always the most recent price, and it is always the most recent price.highandlowAlways represents the highest high and lowest low reached since the start of the current Real-time Bar. These built-in variables represent the final value when Real-time Bar was last updated.The reversal mechanism when executing the strategy on the real-time Bar (real-time price model): In real-time Bar execution, each new iteration of the policy resets the user-defined variable before execution is called a rollback. To understand the rollback mechanism, let's use an example and test the code below.
Please note:
/*backtest
...
..
.
*/
The contents of the packet are retrieval configuration information stored in code on the FMZ platform.
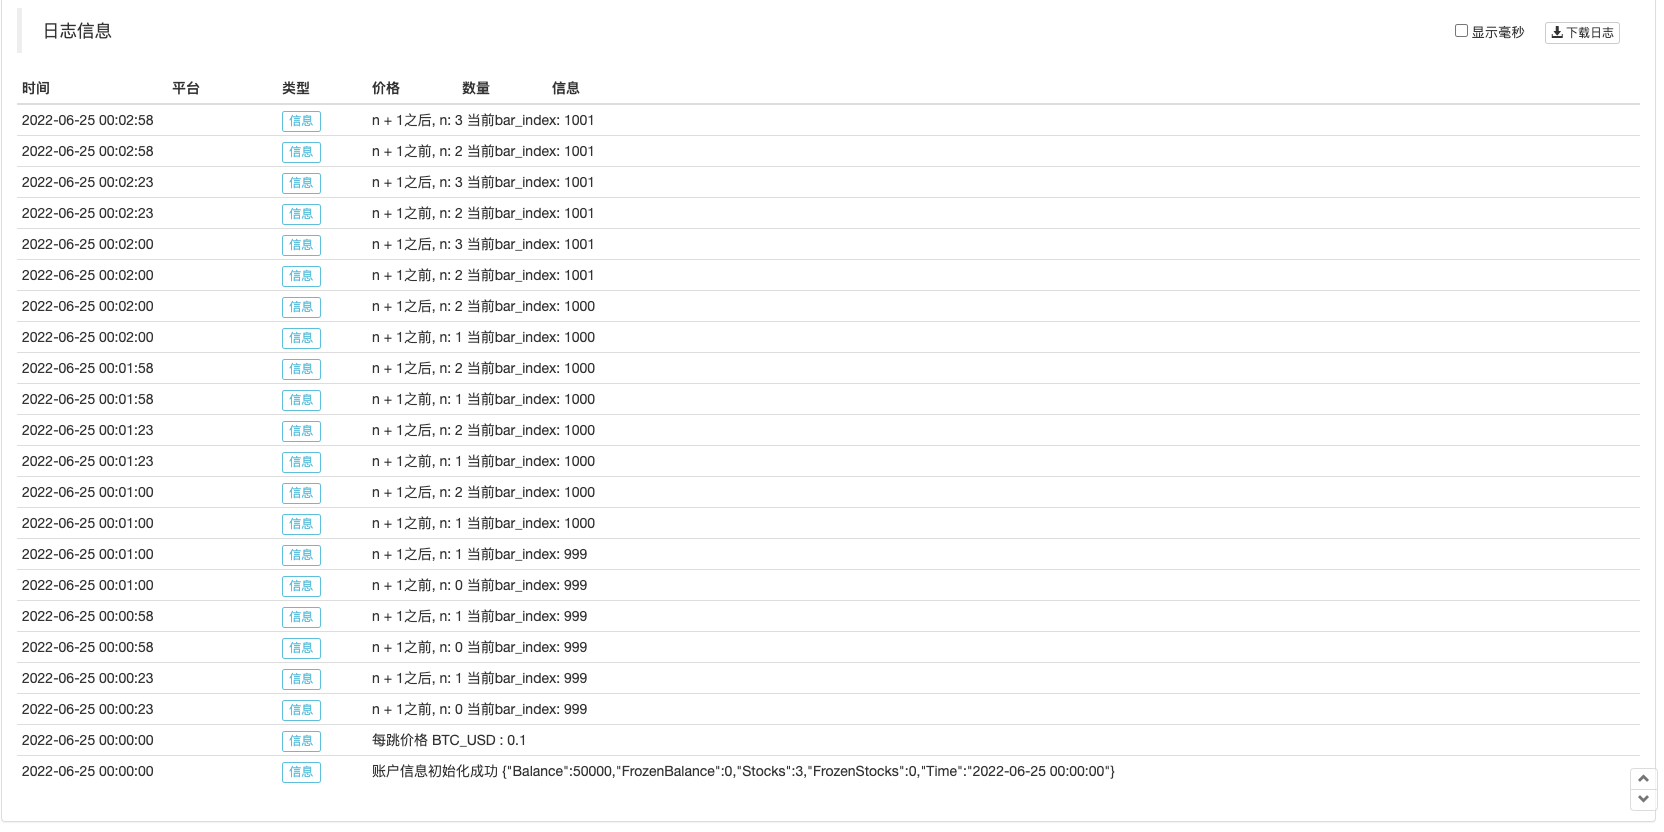
/*backtest
start: 2022-06-03 09:00:00
end: 2022-06-08 15:00:00
period: 1m
basePeriod: 1m
exchanges: [{"eid":"Bitfinex","currency":"BTC_USD"}]
*/

var n = 0
if not barstate.ishistory
    runtime.log("n + 1之前, n:", n, " 当前bar_index:", bar_index)
    n := n + 1
    runtime.log("n + 1之后, n:", n, " 当前bar_index:", bar_index)

plot(n, title="n")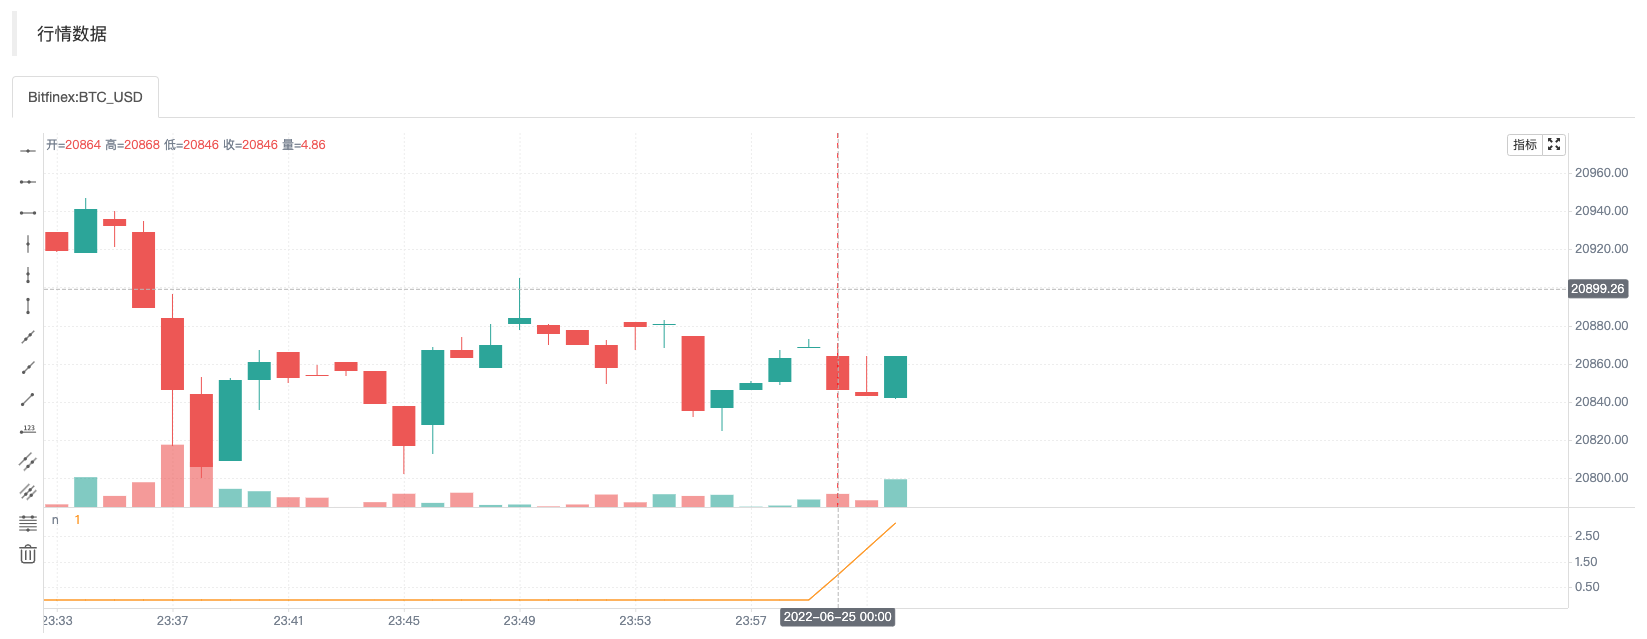
We're only looking at the real-time Bar scenes, so we're using
not barstate.ishistoryExpression constraint is only used for real-time Bar addition to variables n and before and after the addition operationruntime.logFunction output information in the policy log.plotThe drawn curve n can be seen to have been 0 when the policy was running in the historical Bar. It triggers an operation n plus 1 when executed to real-time Bar, and an operation n plus 1 when executed to real-time Bar every time the policy is executed. It can be seen from the log information that n is reset to the value that was finally submitted by the previous one when the policy was executed every time the code is re-executed.In summary: 1, when the policy starts executing in real-time Bar, one policy code is executed for each transaction update. 2, when executed on real-time Bar, the variable is rolled back before each execution of the policy code. 3, when executed on real-time Bar, the variable is submitted once at the time of closing update.
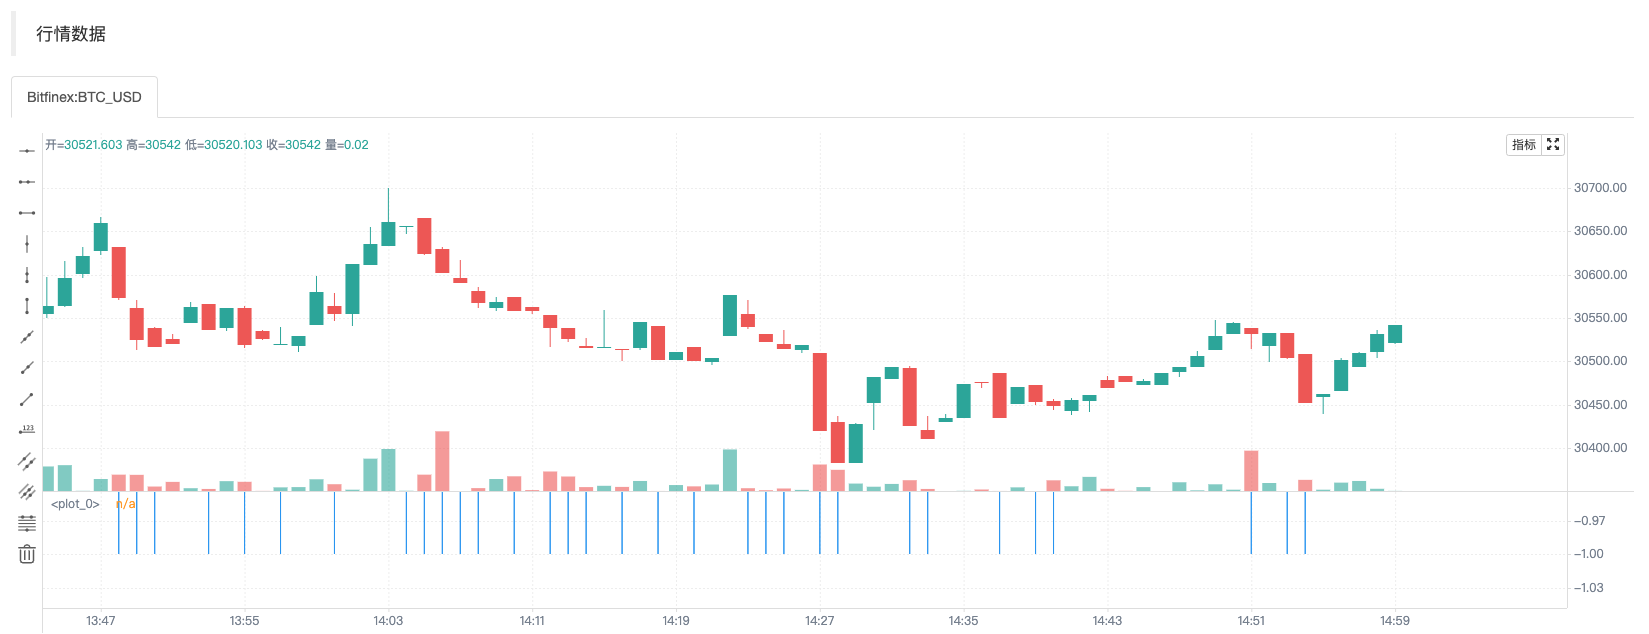
Graph operations such as curves on a graph can also cause redrawing because of data rollback, for example, we just modified the test code, a real-world test:
var n = 0
if not barstate.ishistory
    runtime.log("n + 1之前, n:", n, " 当前bar_index:", bar_index)
    n := open > close ? n + 1 : n
    runtime.log("n + 1之后, n:", n, " 当前bar_index:", bar_index)

plot(n, title="n")
Screenshot of moment A
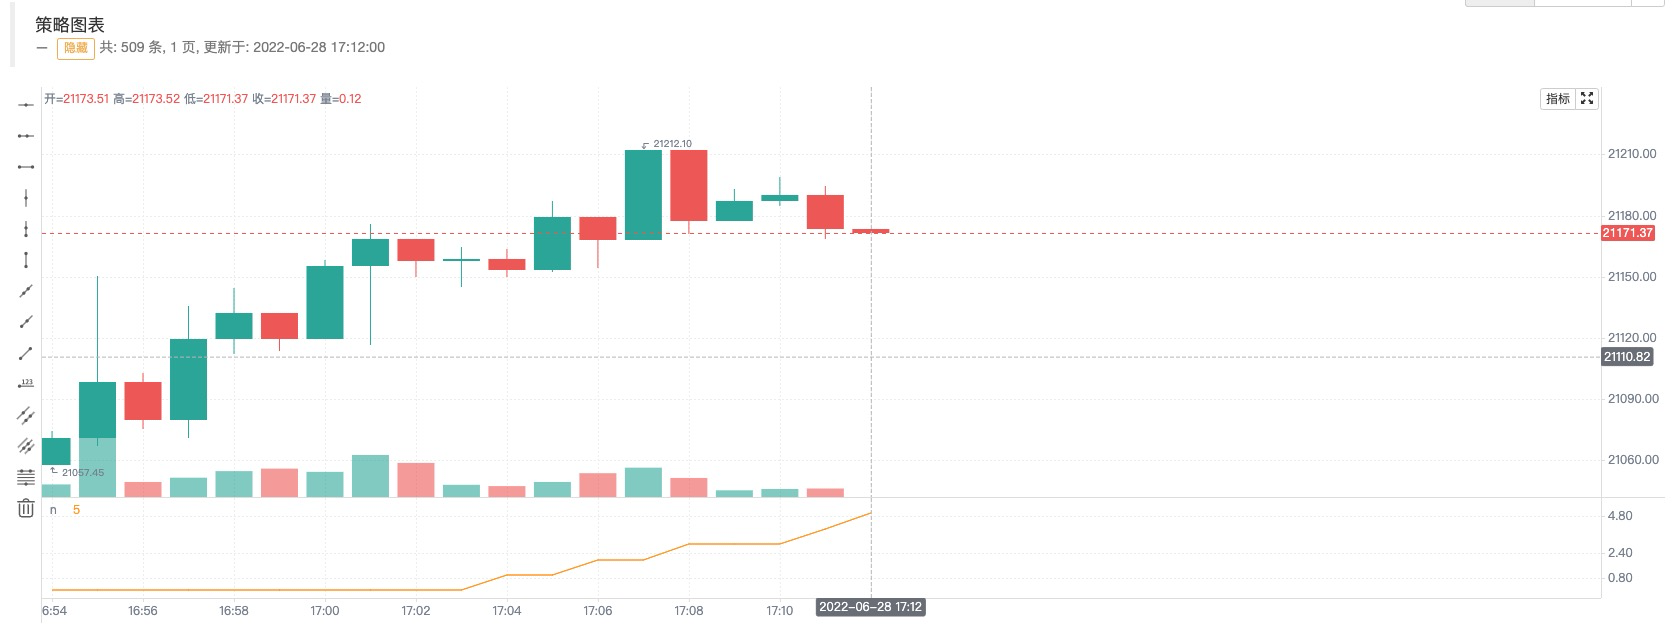
Screenshot from moment B
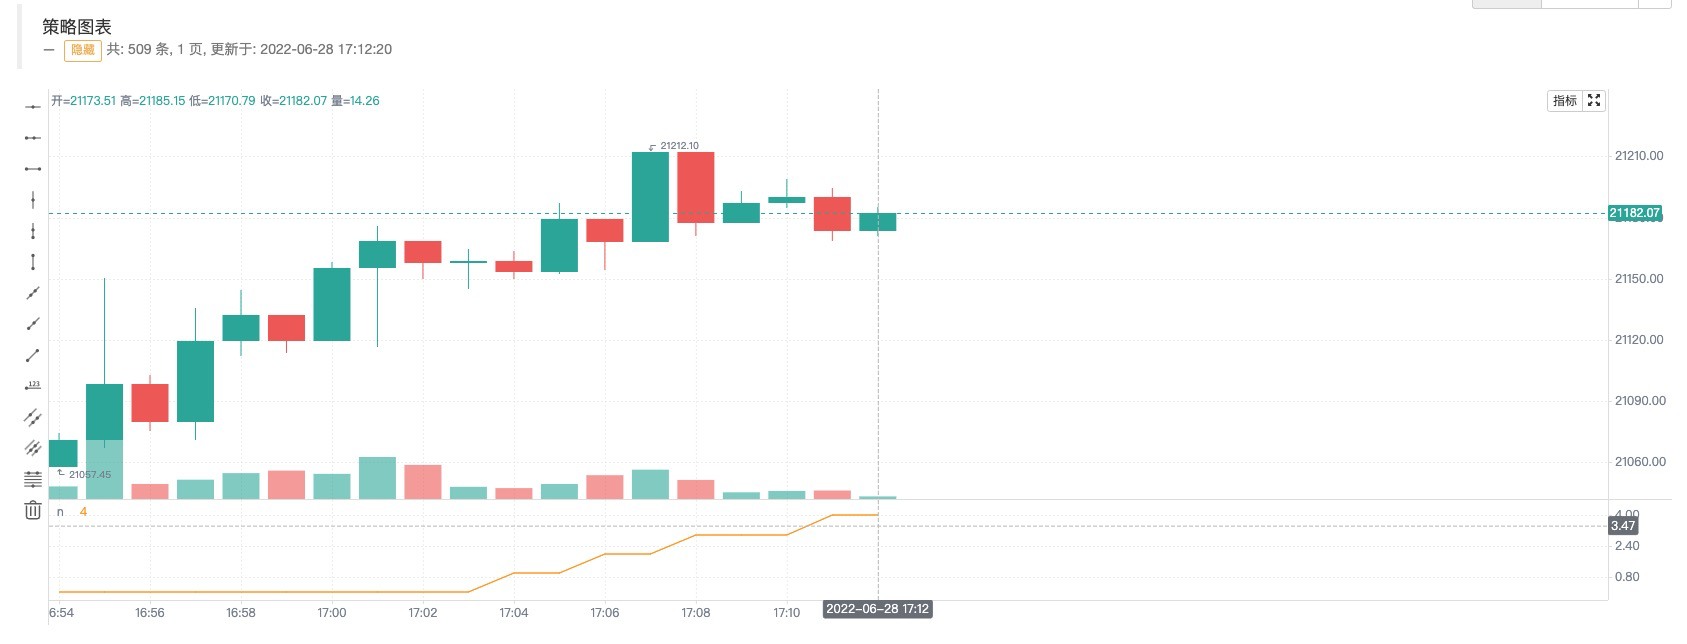
We have only changed this sentence:
n := open > close ? n + 1 : n, the current real-time Bar is a diagonal (i.e. the opening price is higher than the closing price) and only gives n plus 1; as can be seen in the first graph (i.e. moment A), since the opening price is higher than the closing price (i.e. the diagonal) then n is added 1, the graph curve n shows a value of 5; then the trend changes, the price updates as shown in the second graph (i.e. moment B); at this time the opening price is lower than the closing price (i.e. the diagonal), n rolls back and does not add 1; the curve n in the graph is also immediately redrawn, at which point the n on the curve is 4;; so the real-time signals shown on the Bar are uncertain and can change. -
Context of variables in a function
Below, we'll look at variables in the Pine language functions. According to some of the descriptions in the Pine tutorials, variables in the function differ from variables outside the function as follows:
The history of the series of variables used in the pine function is created by each successive call of the function. If the function is not called on each column run by the script, this will result in a difference between the historical value inside the function's local block and the historical value of the external series. Therefore, if the function is not called on each column, the series with the same index value inside the function and the external reference will not refer to the same historical point.
Is it a little hard to read? It's okay, we figured it out with a test code running on FMZ:
/*backtest
start: 2022-06-03 09:00:00
end: 2022-06-08 15:00:00
period: 1m
basePeriod: 1m
exchanges: [{"eid":"Bitfinex","currency":"BTC_USD"}]
*/

f(a) => a[1]
f2() => close[1]

oneBarInTwo = bar_index % 2 == 0
plotchar(oneBarInTwo ? f(close) : na, title = "f(close)", color = color.red, location = location.absolute, style = shape.xcross, overlay = true, char = "A")
plotchar(oneBarInTwo ? f2() : na, title = "f2()", color = color.green, location = location.absolute, style = shape.circle, overlay = true, char = "B")
plot(close[2], title = "close[2]", color = color.red, overlay = true)
plot(close[1], title = "close[1]", color = color.green, overlay = true)
Re-tested run screen
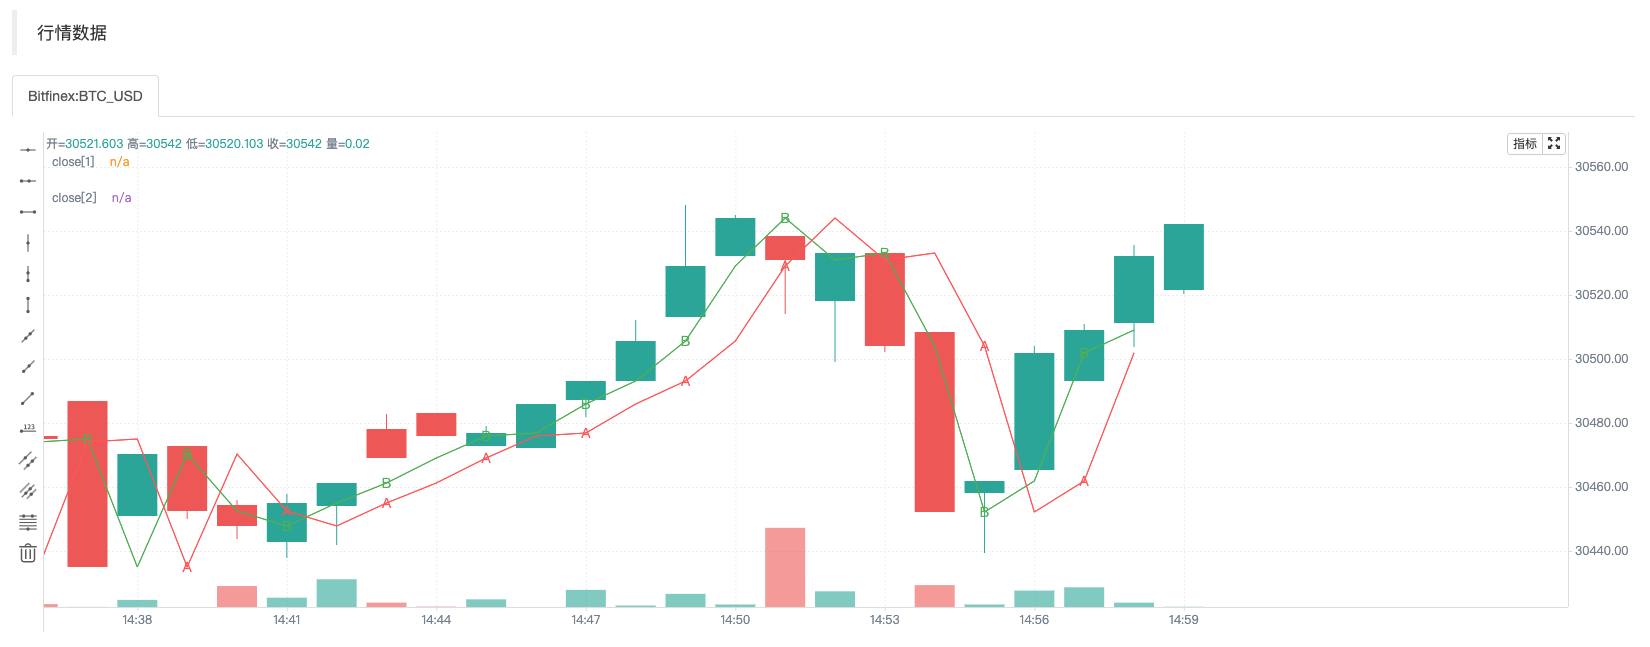
The test code is relatively simple and is mainly used to examine data that is referenced in two ways:
f(a) => a[1]andf2() => close[1]。-
f(a) => a[1]: how to use the pass parameter, the function finally returnsa[1]。 -
f2() => close[1]Direct use of built-in variables:closeSo the function finally returnsclose[1]。
[]The symbol is used to reference the historical value of a variable in a data series, close[1] which refers to the closing price data on the Bar before the current closing price. Our test code draws a total of 4 data on the chart:-
plotchar(oneBarInTwo ? f(close) : na, title = "f(close)", color = color.red, location = location.absolute, style = shape.xcross, overlay = true, char = "A")Draw a character A, colored red, when oneBarInTwo is true, and the position drawn ((on the Y axis) is: f(close)The value returned. -
plotchar(oneBarInTwo ? f2() : na, title = "f2()", color = color.green, location = location.absolute, style = shape.circle, overlay = true, char = "B")Draw a character B, colored green, when oneBarInTwo is true, and the position drawn ((on the Y axis) is:f2()The value returned. -
plot(close[2], title = "close[2]", color = color.red, overlay = true)The drawing line, colored red, is positioned (on the Y-axis):close[2]This is the closing price on the 2nd root of the current number Bar (the 2nd root to the left of the number Bar). -
plot(close[1], title = "close[1]", color = color.green, overlay = true)The drawing line, colored green, is positioned (on the Y-axis):close[1]This is the closing price on the first bar of the current number Bar (one bar to the left).
A screenshot can be seen running through the policy retrieval, although the function used in Figure A is marked
f(a) => a[1]and the function used to mark Figure Bf2() => close[1]Both are used[1] to refer to historical data in a data series, but the position of the "A" and "B" markers on the chart is completely different. The position of the "A" markers always falls on the red line, i.e. the code in the strategy.plot(close[2], title = "close[2]", color = color.red, overlay = true)The line drawn, the data used by the line drawn isclose[2]。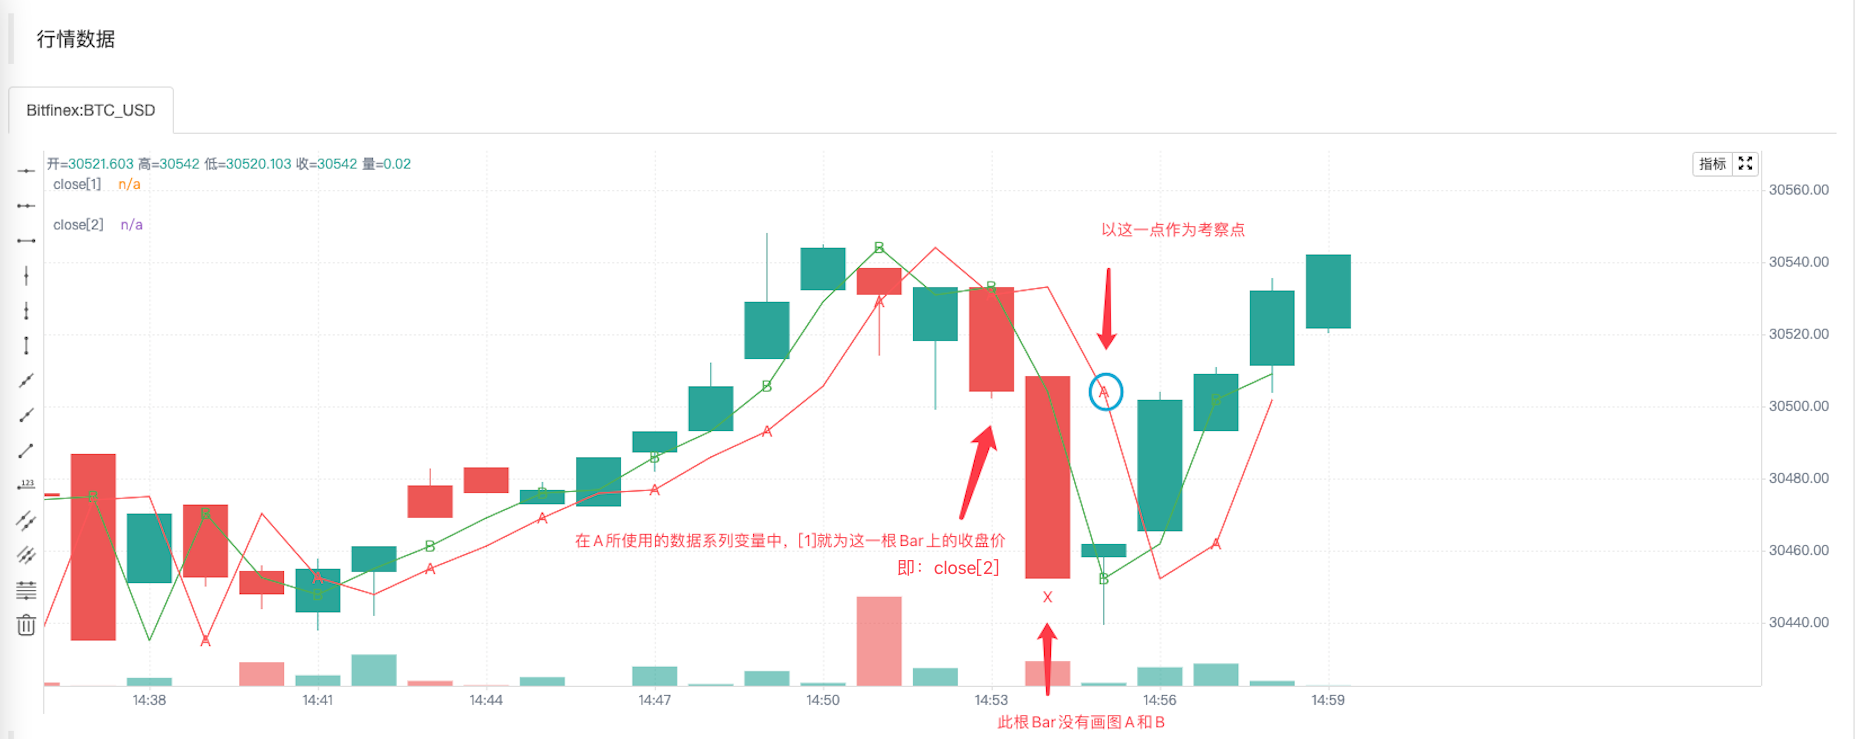
And the reason is that it's going through the index of the K-lineBar, which is the built-in variable.
bar_indexCalculate whether to draw "A" and "B" markers. The "A" and "B" markers are not drawn on each K-line Bar.f(a) => a[1]The value that is referenced in this way will be compared to the function if the function is not called on every bar.f2() => close[1]This way the reference value is not the same (even if the same index is used, such as [1]). -
-
Some built-in functions need to be computed on each Bar to get their results correctly.
This is illustrated by a simple example:
res = close > close[1] ? ta.barssince(close < close[1]) : -1
plot(res, style = plot.style_histogram, color=res >= 0 ? color.red : color.blue)
We're going to call the function code.
ta.barssince(close < close[1])Written in a triangular operatorcondition ? value1 : value2This has led to a decrease in the number of women in the workforce.close > close[1]时去调用ta.barssince函数。可偏偏ta.barssinceThe function is computing from the last time.close < close[1]The number of k-strings at the time of creation; ta.barssince is called close > close[1] so the current closing price is greater than the closing price of the previous Bar, and ta.barssince is called close < close[1] but neither its condition is valid nor is it the most recent location to be created.ta.barssince: When called, the function returns na if the condition was never satisfied before the current K line.
Here is a picture:
So when drawing the graph, we only draw the data when the value of the variable res is ((-1) ).
So to avoid this problem, we can just use
ta.barssince(close < close[1])The function call is taken from the triad operator and written on the outside of any possible conditional branch. It performs calculations on every K-line Bar.a = ta.barssince(close < close[1]) res = close > close[1] ? a : -1 plot(res, style = plot.style_histogram, color=res >= 0 ? color.red : color.blue)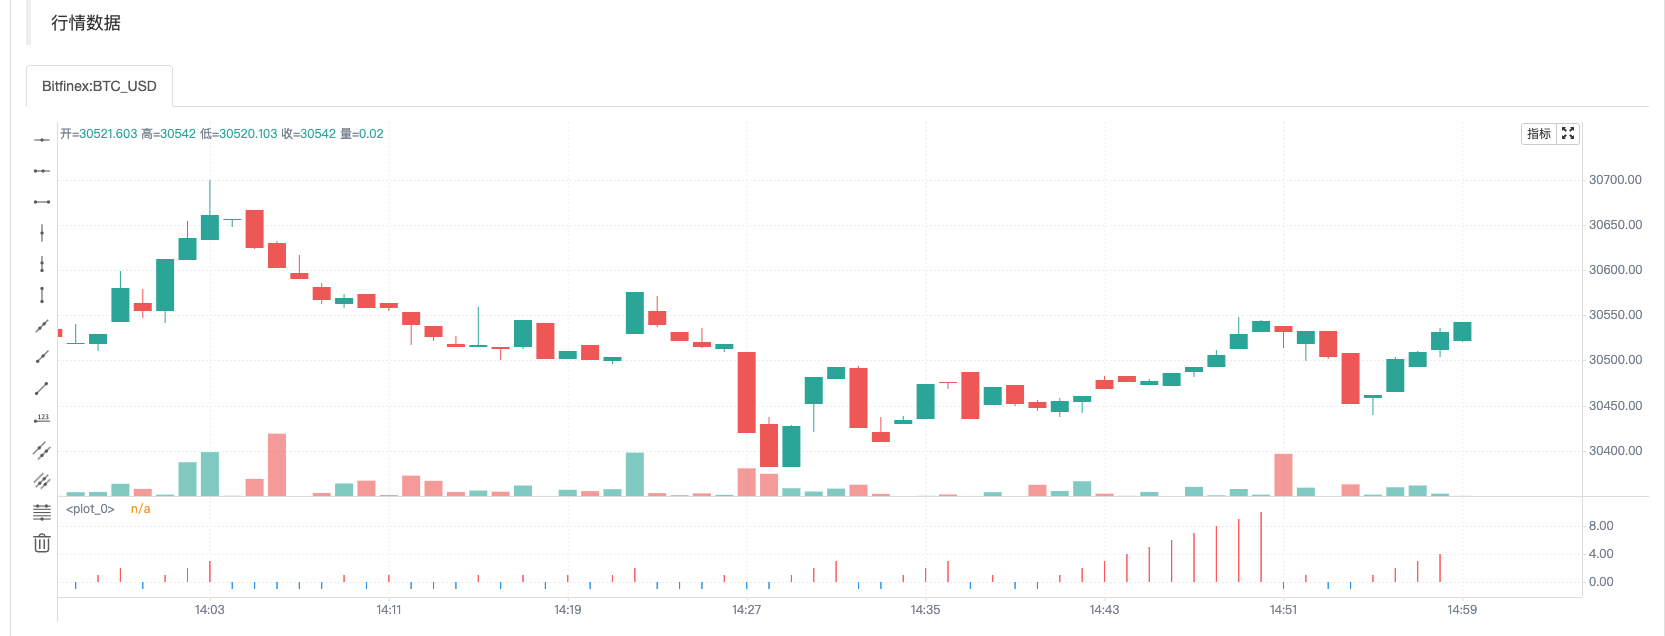
Time series
The concept of time series is very important in the Pine language, and is a concept that we must understand when learning the Pine language. Time series is not a type but a basic structure for continuous values of variables stored over time. We know that the Pine script is based on graphs, and the most basic content displayed in the graphs is a K-bar graph.openis a built-in variable in the Pine language whose structure stores the time sequence for the opening price of each K-line Bar. It can be understood asopenThis time sequence structure represents the opening price of all K-stringBars in the current K-string graph from the first Bar at the beginning to this Bar at the time the current script is executed. If the current K-string is a 5-minute cycle, then we refer to ((or use)) in the Pine policy codeopenThe time is the opening price of the K-lineBar at the current execution using the policy code. If historical values in the time series are to be referenced, use[]Operator. Use when the Pine policy is executed on a K-line Bar.open[1]Indicates referencesopenThe opening price of the previous K-line Bar (i.e. the opening price of the last K-line cycle) of this K-lineBar executed by the current script in the time series.
-
The variables in the time series are very convenient to compute. So we have a built-in function.
ta.cumFor example:ta.cum Cumulative (total) sum of `source`. In other words it's a sum of all elements of `source`. ta.cum(source) → series float RETURNS Total sum series. ARGUMENTS source (series int/float) SEE ALSO math.sumThe test code is:
v1 = 1
v2 = ta.cum(v1)
plot(v1, title="v1")
plot(v2, title="v2")
plot(bar_index+1, title="bar_index")
There's a lot of similarities.
ta.cumSuch built-in functions can directly process data on a time series, such asta.cumThe next step is to add up the corresponding values of the input variables on each K-lineBar, and then we use a graph to make it easy to understand.Strategic operation process The built-in variable bar_index v1 v2 The strategy runs on the 1st root K line Bar. 0 1 1 The strategy runs on the 2nd root K line Bar 1 1 2 The strategy runs on the 3rd root K line Bar. 2 1 3 … … … … The strategy runs on the N+1 root K line Bar N 1 N+1 As you can see, v1, v2 and even bar_index are time series structures with corresponding data on each Bar. This test code distinguishes between "real-time price model" and "closing price model" based on whether real-time Bar is displayed on the chart.
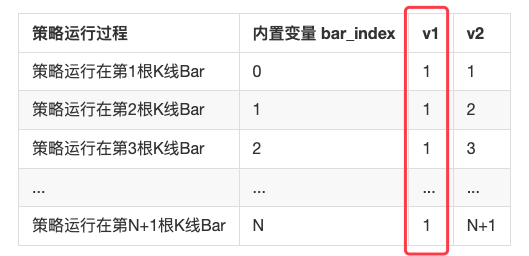
Because the variable v1 is 1, for every bar.
ta.cum(v1)When the function is executed on the first K-line Bar, the result is 1, since only the first Bar is used. The variable v2 is assigned. Whenta.cum(v1)When executed on the second K-line Bar, there are already 2 K-lines Bar (the first corresponding built-in variable bar_index is 0, the second corresponding built-in variable bar_index is 1), so the result is 2, assigning the variable v2, and so on.bar_indexSo if we start at 0 and we increase, then we're going to go from 0 to 0.bar_index + 1This is actually the number of K-bars. The observation graph also shows the line.v2andbar_indexIt's really overlapping.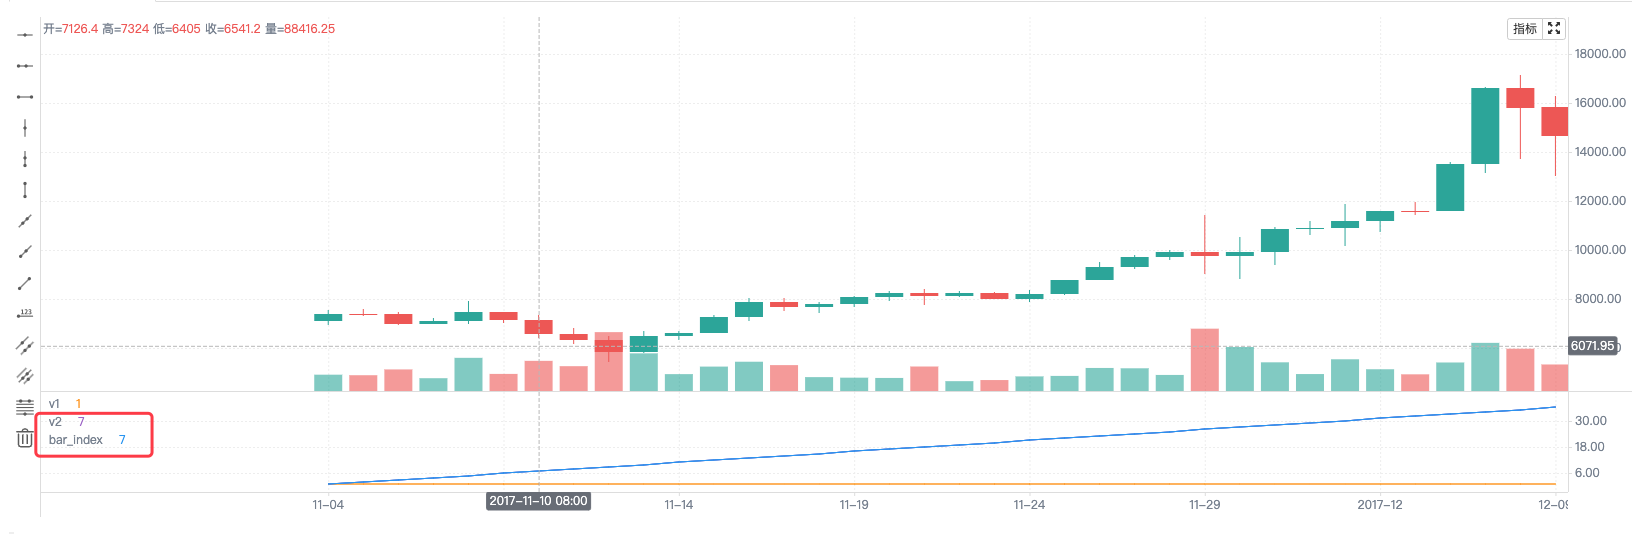
I can use it too.
ta.cumThe built-in function calculates the sum of the closing prices of all Bar on the current chart, and then it can be written simply as:ta.cum(close), when the policy runs to the rightmost real-time barta.cum(close)The result of the calculation is the sum of the closing prices of all the bars on the graph (not running to the rightmost, just adding to the current bar).Variables in a time series can also be computed using operators, such as code:
ta.sma(high - low, 14)The built-in variablehigh(K-line Bar highest price) minuslow(K-line Bar lowest price), last usedta.smaThe function asks for the mean. -
The result of a function call also leaves a value trace in the time sequence.
v1 = ta.highest(high, 10)[1]
v2 = ta.highest(high[1], 10)
plot(v1, title="v1", overlay=true)
plot(v2, title="v2", overlay=true)
The test code is running the test when retested, and it can be observed
v1andv2The values are the same, the lines drawn on the graph are also completely overlapping. The result of a function call that is computed leaves a trace of the value in the time sequence, such as code.ta.highest(high, 10)[1]One of themta.highest(high, 10)The result calculated by calling the function can also be used[1] to reference its historical value. Based on the previous Bar corresponding to the current Barta.highest(high, 10)The result is:ta.highest(high[1], 10)So what?ta.highest(high[1], 10)andta.highest(high, 10)[1]It's a perfect match.Use another drawing function to output validation information:
a = ta.highest(close, 10)[1]
b = ta.highest(close[1], 10)
plotchar(true, title="a", char=str.tostring(a), location=location.abovebar, color=color.red, overlay=true)
plotchar(true, title="b", char=str.tostring(b), location=location.belowbar, color=color.green, overlay=true)
You can see that the values of the variables a and b in the time series are shown above and below the corresponding Bar. This graphic code can be kept during the learning process, as it may often be necessary to output information on the chart for observation during testing.
Script structure
General structure
In the beginning part of the tutorial we summarized some of the differences in the use of Pine on FMZ and the use of Pine on Trading View.indicator()、strategy()I'm not going to say that I'm not.library()◦ Of course, to be compatible with earlier versions of the Pine script, the policy is written as://@version=5,indicator(),strategy()You can also set up some policy settings on the following page:strategy()The parameters are passed in the function.
<version>
<declaration_statement>
<code>
<version>Version control information can be omitted.
Notes
Pine language//As a single-line annotator, FMZ extends the annotator since Pine language does not have multiple-line annotators./**/It is used for multi-line annotations.
The Code
A line in a script that is not a comment or a compiler instruction is a statement that implements the script's algorithm. A statement can be one of these.
- Variable declaration
- Reassignment of variables
- The function declaration
- Built-in function calls, user defined function calls
if,for,whileorswitchand so on.
Sentences can be arranged in many ways.
- Some statements can be expressed in a single line, such as most variable declarations, which contain only one function call line, or single-line function declarations; others, like structures, always require multiple lines because they require a local block.
- The global statements of the script (i.e. the parts that do not belong to the sub-block) cannot be used to describe the entire script.
空格or制表符(tab key) start. Their first character must also be the first character of the line. A line that starts at the first position in the line is, by definition, part of the global scope of the script. - A structure or multi-line function statement always requires a
local blockA local block must be compressed into a semicolon or four spaces (otherwise, it will be parsed as the serial code of the previous line, i.e. determined to be the continuous content of the previous line of code), and each local block defines a different local range. - Multiple single-line statements can be connected in a single line by using the comma ((,) as a separator.
- A line can contain a commentary or just a commentary.
- A line can also be wrapped (continue on multiple lines).
For example, include three local blocks, one in a custom function declaration, two in a variable declaration using an if structure, code as follows:
indicator("", "", true)             // 声明语句(全局范围),可以省略不写

barIsUp() =>                        // 函数声明(全局范围)
    close > open                    // 本地块(本地范围)

plotColor = if barIsUp()            // 变量声明 (全局范围)
    color.green                     // 本地块 (本地范围)
else
    color.red                       // 本地块 (本地范围)

runtime.log("color", color = plotColor)  // 调用一个内置函数输出日志 (全局范围)
Change the code
Long rows can be split into multiple rows, or "wrapped" up. The wrapped row must compress any number of spaces, as long as it is not a multiple of 4 (these boundaries are used to compress local blocks).
a = open +
      high +
          low +
             close
It can be packaged as (note that the number of spaces that are compressed per line is not a multiple of 4):
a = open +
high +
low +
close
A long plot ((()) call can be wrapped up in a.
close1 = request.security(syminfo.tickerid, "D", close)      // syminfo.tickerid 当前交易对的日线级别收盘价数据系列
close2 = request.security(syminfo.tickerid, "240", close)    // syminfo.tickerid 当前交易对的240分钟级别收盘价数据系列
plot(ta.correlation(close, open, 100),                       // 一行长的plot()调用可以被包装
   color = color.new(color.purple, 40),
   style = plot.style_area,
   trackprice = true)
Statements in user-defined function declarations can also be wrapped. However, since the local block must syntactically start with a contraction (four spaces or one check mark), when dividing it into the next line, the continuation of the statement must start with more than one contraction (not equal to a multiple of four spaces). For example:
test(c, o) =>
    ret = c > o ?
       (c > o+5000 ?
          1 :
              0):
       (c < o-5000 ?
          -1 :
              0)


a = test(close, open)
plot(a, title="a")
Identifier and operator
Identifier
Before understanding the variables, we first need to understand the concept of the symbols of the array.FunctionandVariableThe name of the function (which is used to name variables, functions) ≠ ∞.FunctionAs we will see in our next tutorial, we will first learn the symbols of the symbols.
- 1, the identifier must be capitalized.
(A-Z)or lower case.(a-z)Letters or underscores(_)In the beginning, the first character of the identifier. - The next character after the first character of the identifier can beLetters、Lower boundaryorNumbers。
- 3, The name of the identifier is written in upper case.
For example, the following identifiers are named:
fmzVar
_fmzVar
fmz666Var
funcName
MAX_LEN
max_len
maxLen
3barsDown  // 错误的命名!使用了数字字符作为标识符的开头字符
As with most programming languages, Pine has written suggestions. It is usually recommended that when naming identifiers:
- 1, all capital letters used to name constants.
- 2, useThe Little Hump ruleThe name is used for other identifiers.
// 命名变量、常量
GREEN_COLOR = #4CAF50
MAX_LOOKBACK = 100
int fastLength = 7

// 命名函数
zeroOne(boolValue) => boolValue ? 1 : 0
The operator
Operators are some of the operational symbols used in programming languages to construct expressions, and expressions are computational rules designed for some computational purpose when we write policies. Operators in the Pine language are classified according to function as:
Assignment operators, arithmetic operators, comparison operators, logical operators, and so on.? :The three-dimensional operator,[]The historical reference operator.
Operator with arithmetic*For example, the type of problem that results from the return of a Pine language operator in Trading View is distinguished by the following test code:
//@version=5
indicator("")
lenInput = input.int(14, "Length")
factor = year > 2020 ? 3 : 1
adjustedLength = lenInput * factor
ma = ta.ema(close, adjustedLength)  // Compilation error!
plot(ma)
This script will compile an error message when executed in Trading View because:adjustedLength = lenInput * factorSo the result isseries intType ((series), howeverta.emaThe second parameter of the function does not support this type. However, there are no such strict restrictions on FMZ, and the above code can be run normally.
In the following, we'll look at the use of various operators.
Assignment operator
There are two types of assignment operators:=、:=We've seen this in a few examples from the beginning of this tutorial.
=Operators are used to assign values to variables when initializing or declaring them.=Initialization, the variable after the declaration assignment will start with this value on each subsequent Bar. These are valid variable declarations:
a = close           // 使用内置变量赋值给a
b = 10000           // 使用数值赋值
c = "test"          // 使用字符串赋值
d = color.green     // 使用颜色值赋值
plot(a, title="a")
plot(b, title="b")
plotchar(true, title="c", char=str.tostring(c), color=d, overlay=true)
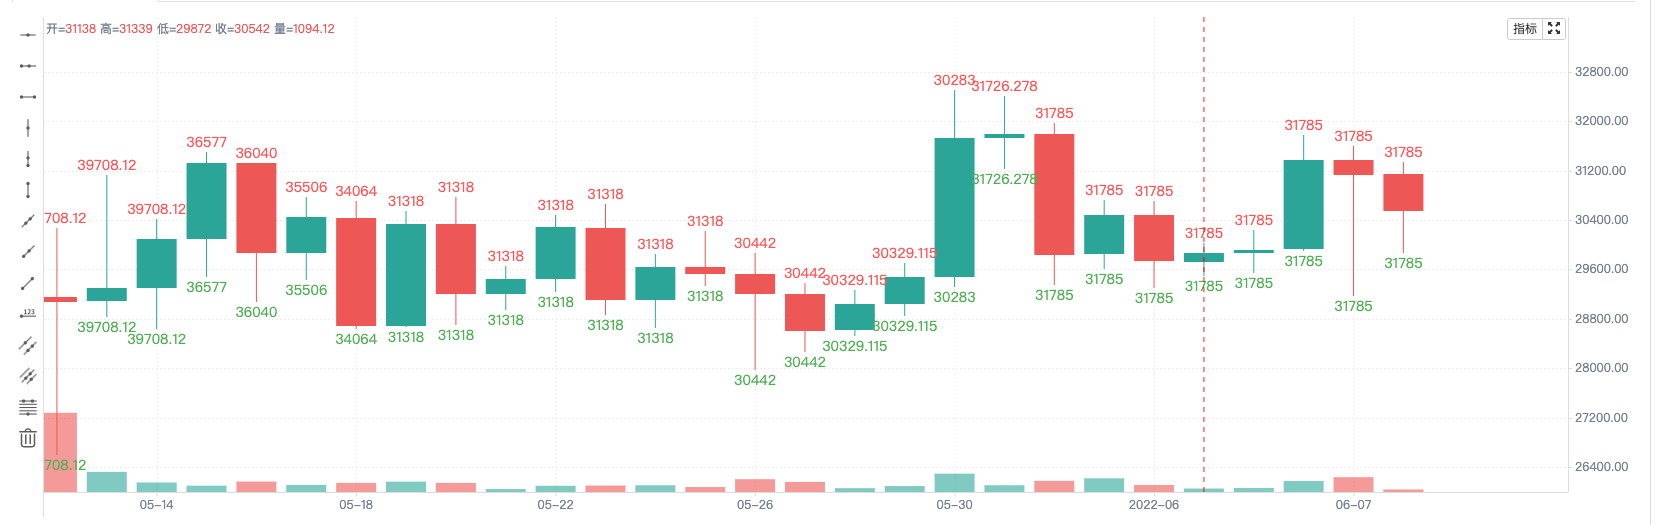
Be careful.a = closeAssignment statements, in which the variable a on each Bar is the current close price of that Bar; other variablesb、c、dThe results of the test are shown in the diagram below.
:=It is used to re-assign values to existing variables, which can be understood simply as using:=Operators are used to modify the value of a variable that has already been declared, initialized.
If used:=An operator assigns an uninitialized or declared variable assignment that causes an error, such as:
a := 0
So, what do you think?:=Assignment operators are generally used to re-assign existing variables, such as:
a = close > open
b = 0
if a
    b := b + 1

plot(b)
Judge ifclose > open(i.e. the current BAR is the diagonal), a variable is true. It executes the code in the local block of the if statement.b := b + 1, using the assignment operator:=Re-assign a value to b, add a 1; then use the plot function to plot the value of variable b on each BAR in the time series on the graph, connected in a linear fashion.
Do we assume that if we have a diagonal BAR, b will continue to add 1? Of course not, here we are declaring variable b, without using any keyword specification when initializing to 0.b=0So you can see that the result of running this code is to reset the variable b to 0 every time if the variable a is true.close > openThen b is 1 when the plot function is plotted, but b is assigned 0 again when the next round of code is executed. This is also where the pine language beginners can easily step into the hole.
In the case of assignment operators, it is necessary to expand on two key words:var、varip
-
var
In fact, we've seen this keyword used in previous tutorials, but it wasn't discussed in detail at the time.
var is a keyword used to allocate and initialize variables once. Typically, a variable assignment syntax that does not include the keyword var will result in variable values being overlaid each time the data is updated. Conversely, when var is used to allocate variables, they can be kept in a state of flux even though the data is updated.
We're still using this example, but we're just using it when we're assigning b.
varThe keyword is.a = close > open var b = 0 if a b := b + 1 plot(b)varThe keyword allows the variable b to execute only the initial first assignment, and does not reset b to 0 each time the strategy logic is executed, so the line drawn from the run can be observed to be b, which is a regression to the number of rays of light that appeared at the current K line BAR.Variables with var declarations can be written not only globally, but also in blocks of code, such as this example:
strategy(overlay=true)
var a = close
var b = 0.0
var c = 0.0
var green_bars_count = 0
if close > open
    var x = close
    b := x
    green_bars_count := green_bars_count + 1
    if green_bars_count >= 10
        var y = close
        c := y
plot(a, title = "a")
plot(b, title = "b")
plot(c, title = "c")
The variable
a maintains the closing price of the first column line in the series. Variable b remained the closing price of the first in the series. Variable c remained the closing price of the tenth in the series. -
varip
varipThe first time we see this keyword, we can look at the description of this keyword:varip (var intrabar persist) is a keyword used to allocate and initialize variables once. It is similar to the var keyword, but a variable with a varip declaration retains its value between real-time K-line updates.
Is it more difficult to understand? It's okay, we explain it with examples, it's easy to understand.
strategy(overlay=true)

// 测试 var varip
var i = 0
varip ii = 0

// 将策略逻辑每轮改变的i、ii打印在图上
plotchar(true, title="ii", char=str.tostring(ii), location=location.abovebar, color=color.red)
plotchar(true, title="i", char=str.tostring(i), location=location.belowbar, color=color.green)

// 每轮逻辑执行都给i、ii递增1
i := i + 1
ii := ii + 1
This test code has a different behavior in the "closing price model" or "real-time price model":
Real-time pricing model: Do you remember that we talked earlier about the strategy execution time being divided into the historical BAR phase, the real-time BAR phase?
var、varipVariables in the declarationi、iiIncremental operations are performed every round of execution of the strategy code. So you can see that the numbers shown on the K-line BAR of the retrieval result are each incremented by 1 at the end of the historical K-line phase and the beginning of the real-time K-line phase. The variables in the var, varip declaration begin to change differently.i := i + 1andii := ii + 1The difference is that ii is modified every time. Although i is modified every time, the previous value is restored when the next round of execution of the policy logic is executed (remember the rollback mechanism we discussed in the previous chapter "Model Execution?"), the value of i is not determined until the current K line BAR is updated (i.e. the previous value is no longer restored when the next round of execution of the policy logic is executed).The closing price model: Since the closing price model executes one strategy logic at the end of each K-line BAR, the variables of the historical K-line phase and the real-time K-line phase, var, varip and varip declarations are perfectly consistent in the above example of incremental performance, with BAR incrementing by 1 per K-line.
Arithmetic operator
| The operator | Explained |
|---|---|
| + | French |
| - | Reduced |
| * | Multiply |
| / | Excluded |
| % | Finding a Model |
+、-The operator can be used as a binary operator or as a primary operator. Other arithmetic operators can only be used as a binary operator and will return an error if used as a primary operator.
1, the numerical operator has a numerical type on both sides, resulting in a numerical type, integer or floating point number depending on the result of the operation.
2 if the operator is a string, the operator is+The result of the calculation is a string, the value is converted to the form of a string, and then the string is spliced together. If it is another arithmetic operator, it tries to convert the string to a number and then performs the operation.
3, if one of the operators is na, the result is null na, which is displayed as NaN when printed on the FMZ.
a = 1 + 1
b = 1 + 1.1
c = 1 + "1.1"
d = "1" + "1.1"
e = 1 + na

runtime.log("a:", a, ", b:", b, ", c:", c, ", d:", d, ", e:", e)
// a: 2 , b: 2.1 , c: 11.1 , d: 11.1 , e: NaN
There is a slight difference between FMZ's Pine language and Trading View's Pine language, which is not very strict about variable type requirements. For example:
a = 1 * "1.1"
b = "1" / "1.1"
c = 5 % "A"

plot(a)
plot(b)
plot(c)
It can be run on FMZ, but it will report type errors in trading view. For arithmetic operators where the operation numbers on both sides of the arithmetic operator are strings, the system converts the strings to numeric values and calculates them. If the non-numerical string cannot be calculated, the system calculates the result as null na.
Comparison operator
The comparison operator is a binary operator.
| The operator | Explained |
|---|---|
| < | Less than |
| > | Greater than |
| <= | Less than is equal to |
| >= | is greater than or equal to |
| == | Equal |
| != | Different |
Test example:
a = 1 > 2
b = 1 < 2
c = "1" <= 2
d = "1" >= 2
e = 1 == 1
f = 2 != 1
g = open > close
h = na > 1
i = 1 > na

runtime.log("a:", a, ", b:", b, ", c:", c, ", d:", d, ", e:", e, ", f:", f, ", g:", g, ", h:", h, ", i:", i)
// a: false , b: true , c: true , d: false , e: true , f: true , g: false , h: false , i: false
As you can see, the comparison operator is very simple to use, but this is also the one we use the most when writing a policy.close、openAnd so on and so forth.
As with the operand, the FMZ differs from the Trading View's Pine in that the FMZ does not have a particularly stringent requirement type, so statements like this one are more likely to be used in the FMZ.d = "1" >= 2In FMZ there is no error reporting, the string is converted to a value before the comparison operation is performed. In Trading View there is an error reporting.
Logical operators
| The operator | The code symbol | Explained |
|---|---|---|
| Not | not | Unitary operator, not operated |
| and | and | Binary operator, which works with ((and) |
| or | or | Binary operators, or operations |
If we're talking about logical operators, then we're talking about the real-values table. It's the same as we learned in high school, except here we're testing in a regression system.
a = 1 == 1  // 使用比较运算符构成的表达式,结果为布尔值
b = 1 != 1
c = not b   // 逻辑非操作符
d = not a   // 逻辑非操作符

runtime.log("测试逻辑操作符:and", "#FF0000")
runtime.log("a:", a, ", c:", c, ", a and c:", a and c)
runtime.log("a:", a, ", b:", b, ", a and b:", a and b)
runtime.log("b:", b, ", c:", c, ", b and c:", b and c)
runtime.log("d:", d, ", b:", b, ", d and b:", d and b)

runtime.log("测试逻辑操作符:or", "#FF0000")
runtime.log("a:", a, ", c:", c, ", a or c:", a or c)
runtime.log("a:", a, ", b:", b, ", a or b:", a or b)
runtime.log("b:", b, ", c:", c, ", b or c:", b or c)
runtime.log("d:", d, ", b:", b, ", d or b:", d or b)

runtime.error("stop")
In order to prevent the continuous printing of information by the retesting system from interfering with the observation, we used theruntime.error("stop")After the statement has been printed once, an unusual error is thrown to stop the retrieval, after which the output information can be observed, and it can be found that the printed content and the true value table are actually the same.
The three-value operator
Using three-dimensional operators? :The three-dimensional expressions that are combined with the operandscondition ? valueWhenConditionIsTrue : valueWhenConditionIsFalseWe've been familiar with this in previous lessons. The so-called three-dimensional expression, the three-dimensional operator, means that there are three operations in total.
condition ? valueWhenConditionIsTrue : valueWhenConditionIsFalseIn the middle,conditionIf the expression is true, the value of the expression is:valueWhenConditionIsTrue❖ IfconditionThe value of the hypotenuse isvalueWhenConditionIsFalse。
The following is an example of a simple demonstration, although it has no practical use:
a = close > open
b = a ? "阳线" : "阴线"
c = not a ? "阴线" : "阳线"
plotchar(a, location=location.abovebar, color=color.red, char=b, overlay=true)
plotchar(not a, location=location.belowbar, color=color.green, char=c, overlay=true)
If you run into a cross star, it doesn't matter! Trinitarian expressions can also be nested, as we did in previous tutorials.
a = close > open
b = a ? math.abs(close-open) > 30 ? "阳线" : "十字星" : math.abs(close-open) > 30 ? "阴线" : "十字星"
c = not a ? math.abs(close-open) > 30 ? "阴线" : "十字星" : math.abs(close-open) > 30 ? "阳线" : "十字星"
plotchar(a, location=location.abovebar, color=color.red, char=b, overlay=true)
plotchar(not a, location=location.belowbar, color=color.green, char=c, overlay=true)
It's actually the equivalent ofcondition ? valueWhenConditionIsTrue : valueWhenConditionIsFalseThe insidevalueWhenConditionIsTrue、valueWhenConditionIsFalse, also uses another three-dimensional expression instead.
The historical operator
Using historical operators[], historical values on the reference time series. These historical values are the values on the K-line BAR before the current K-line BAR when the script is running.[]Operators are used after a variable, expression, or function call.[]The value in this parenthesis is the deviation of the historical data we are referring to from the current K-line BAR. For example, if I were to refer to the closing price of a previous K-line BAR, it would be:close[1]。
We've seen similar writing in previous courses:
high[10]
ta.sma(close, 10)[1]
ta.highest(high, 10)[20]
close > nz(close[1], open)
[]The operator can only be used once on the same value, so it is written incorrectly and will return an error:
a = close[1][2] // 错误
And you can see here, some of the students will say, the operator is a little bit more than a little bit of a bit of a bit of a bit of a bit of a bit of a bit of a bit of a bit of a bit of a bit of a bit of a bit of a bit of a bit.[]It's used for series structures, which looks like series and arrays!
The following is an example to illustrate the difference between a series and an array in Pine.
strategy("test", overlay=true)

a = close
b = close[1]
c = b[1]

plot(a, title="a")
plot(b, title="b")
plot(c, title="c")
Althougha = close[1][2]This is a mistake, but:
b = close[1]
c = b[1]
If you take the normal arithmetic, you can see that there is no error in spelling.b = close[1]After the assignment, b should be a number, however.c = b[1]b can still be used again to refer to a historical value using the history operator. As can be seen, the series concept in the Pine language is not as simple as the array. It can be understood as the historical value on the previous Bar that is close to b. b is also a time series structure that can continue to refer to its historical value. So we see that in the three lines a, b, and c drawn, the b line is one BAR slower than the a line and the c line is one BAR slower than the b line. c line is two BARs slower than the a line.
We can drag the graph to the far left and observe that on the first K-line, the values of b and c are both nulls ((na)). This is because when the script is executed on the first K-line BAR, the forward reference of one, two cycle historical values is not present. So we need to be careful when writing a policy, whether the historical data is referenced to nulls.na、nzAnd we've actually touched on this in previous studies.nz、naFunctions, remember which section?) specifically deals with empty values, for example:
close > nz(close[1], open) // 当引用close内置变量前一个BAR的历史值时,如果不存在,则使用open内置变量
This is a treatment for possible references to nulls ((na)).
Priority of operators
We've learned a lot of Pine operators that form expressions through various combinations of operators and operators. So what's the priority of these operations when they're computing in an expression? It's like the quadratic operations we learned in school, where multiplication takes precedence over multiplication, and then addition and subtraction.
| Priorities | The operator |
|---|---|
| 9 | [] |
| 8 | The time value of the unit operator+ 、-andnot |
| 7 | *、/、% |
| 6 | When the binary operator+、- |
| 5 | >、<、>=、<= |
| 4 | ==、!= |
| 3 | and |
| 2 | or |
| 1 | ?: |
The high-priority part of an expression is operated first, and if the priority is the same, it is operated from left to right.()This is the first part of the expression to be encapsulated.
Variable
Variable declaration
We've already learned the concept of the hash symbol, which is the name of the variable. So, a variable is a stored value symbol. So how do you declare a variable?
-
The declaration pattern: The first thing to write when declaring a variable is "declaration mode". 1, use the keyword
varI'm not sure. Use the keyword 2.varipI'm not sure. 3, nothing written.var、varipThe keyword is actually something we learned in the previous section of "Assignment Operator" and we won't talk about it here. If the declaration pattern of the variable doesn't say anything, for example:i = 1In fact, we have already said that the variables and assignments declared in this way are executed on every K line BAR. -
Types The Pine language on FMZ is not strict about type requirements and can generally be omitted. However, to be compatible with scripting policies on Trading View, variables can also be declared with a type. For example:
int i = 0
float f = 1.1
Types in Trading View are more stringent and will return an error if the following code is used in Trading View:
baseLine0 = na // compile time error! -
Identifier The name of the identifier is the name of the variable, the name of the identifier has already been mentioned in the previous chapter, you can look back:https://www.fmz.com/bbs-topic/9390#标识符
To summarize, a declarative variable can be written as:
// [<declaration_mode>] [<type>] <identifier> = value
   声明模式             类型     标识符       = 值
Here the assignment operator is used:=When a variable is declared, it is assigned a value. When assigned, the value can be a string, a numeric value, an expression, a function call, or a function call.if、 for、whileorswitchThe structure of if statements (these are structured keywords, and the use of these statements will be explained in more detail in our next lesson, in fact we have learned in previous lessons the simple if statement assignment, which can be revisited).
Here we focus on the input function, which is a function that we use a lot when we design policies. It is also a very critical function when we design policies.
The input function:
input函数,参数defval、title、tooltip、inline、group
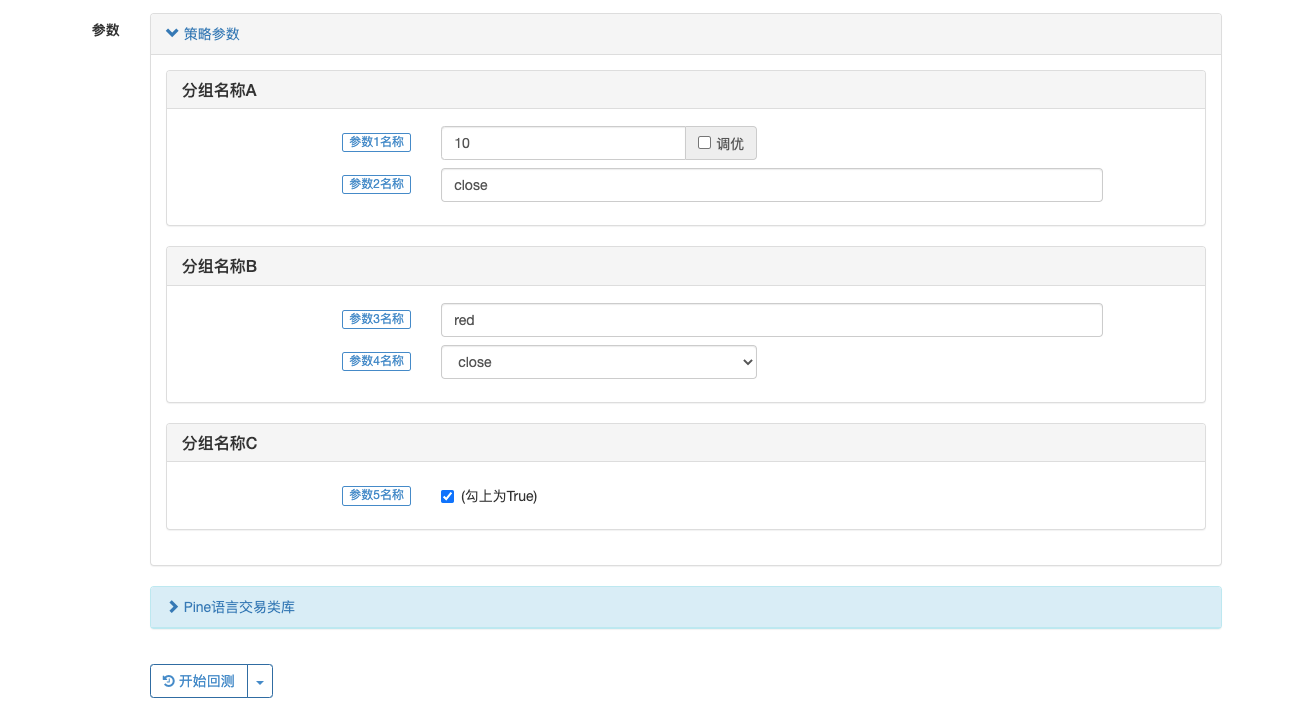
The input function on the FMZ is slightly different from that on the Trading View, although the function is used as an assignment input for the policy parameters. The following is an example of the use of the input function on the FMZ:
param1 = input(10, title="参数1名称", tooltip="参数1的描述信息", group="分组名称A")
param2 = input("close", title="参数2名称", tooltip="参数2的描述信息", group="分组名称A")
param3 = input(color.red, title="参数3名称", tooltip="参数3的描述信息", group="分组名称B")
param4 = input(close, title="参数4名称", tooltip="参数4的描述信息", group="分组名称B")
param5 = input(true, title="参数5名称", tooltip="参数5的描述信息", group="分组名称C")

ma = ta.ema(param4, param1)
plot(ma, title=param2, color=param3, overlay=param5)
Input functions are often used when declaring variables. Input functions automatically draw the controls used to set the policy parameters in the FMZ policy interface. The controls currently supported on FMZ include numeric input boxes, text input boxes, drop boxes, and check boxes.
We've introduced a few main parameters of the input function:
- defval: the default value of the policy parameter option set by the input function, supporting built-in variables, numbers, and strings in the Pine language
- title : the name of the parameter that the policy displays on the policy interface of the disk/retested policy.
- tooltip: A hint for the policy parameter, which displays text information about the policy parameter setting when the mouse is held over the policy parameter.
- group: a name for a policy parameter grouping, which can be given to a parameter grouping.
In addition to declaring individual variables and assigning values, Pine has a set of declaring variables and assigning values:
[变量A,变量B,变量C] = 函数 或者 ```if```、 ```for```、```while```或```switch```等结构
The most common is that we useta.macdWhen calculating MACD indicators, the MACD indicator is a multiline indicator, so three sets of data are calculated.
[dif,dea,column] = ta.macd(close, 12, 26, 9)

plot(dif, title="dif")
plot(dea, title="dea")
plot(column, title="column", style=plot.style_histogram)
It is easy to draw MACD charts using the above code, and not only can built-in functions return multiple variables, but written custom functions can also return multiple data.
twoEMA(data, fastPeriod, slowPeriod) =>
    fast = ta.ema(data, fastPeriod)
    slow = ta.ema(data, slowPeriod)
    [fast, slow]

[ema10, ema20] = twoEMA(close, 10, 20)
plot(ema10, title="ema10", overlay=true)
plot(ema20, title="ema20", overlay=true)
Writing structures such as if as multiple variable assignments is similar to the way custom functions are written above. It is also interesting to try.
[ema10, ema20] = if true
    fast = ta.ema(close, 10)
    slow = ta.ema(close, 20)
    [fast, slow]

plot(ema10, title="ema10", color=color.fuchsia, overlay=true)
plot(ema20, title="ema20", color=color.aqua, overlay=true)
Conditional structure
Some functions cannot be written in the local code block of the conditional branch, mainly the following functions:
barcolor(), fill(), hline(), indicator(), plot(), plotcandle(), plotchar(), plotshape()
Trading View compiles error reports. FMZ is less restrictive, but it is also recommended to follow the rules of writing on Trading View. For example, this is not recommended to write this, although it is not recommended to report errors on FMZ.
strategy("test", overlay=true)
if close > open
    plot(close, title="close")
else
    plot(open, title="open")
If language
- What interface can be used to get the market value of the currencies?
- Is there anyone who can help?
- Sharing a trend strategy
- Foresight for the common man
- I hope FMZ officially publishes the project.
- What is leverage?
- Bin An's campaign strategy application
- Precision issues
- Is there a way to remove a table line?
- I've been getting no signals on the retest. Can you fix it?
- Please ask how to draw the earnings chart for the multi-currency.
- Digital currency
- Currency value
- Can you see, the Mac language's strategy is that both the test and the hard drive are working properly, that is, the phone's hard drive is there and click on it to show an error, what's the situation?
- Retest visualization does not show the buy and sell icon
- Delayed
- Is the public retrieval server not working?
- The server is offline, no trace.
- GetOrder id is not able to access order information
- What's the difference between a closing price model and a real-time price model? For example, if I'm on a 15 minute K-string, will the closing price model cause a large deviation of the transaction price?