RSI and Moving Average Crossover Multi Timeframe Trading Strategy

Overview
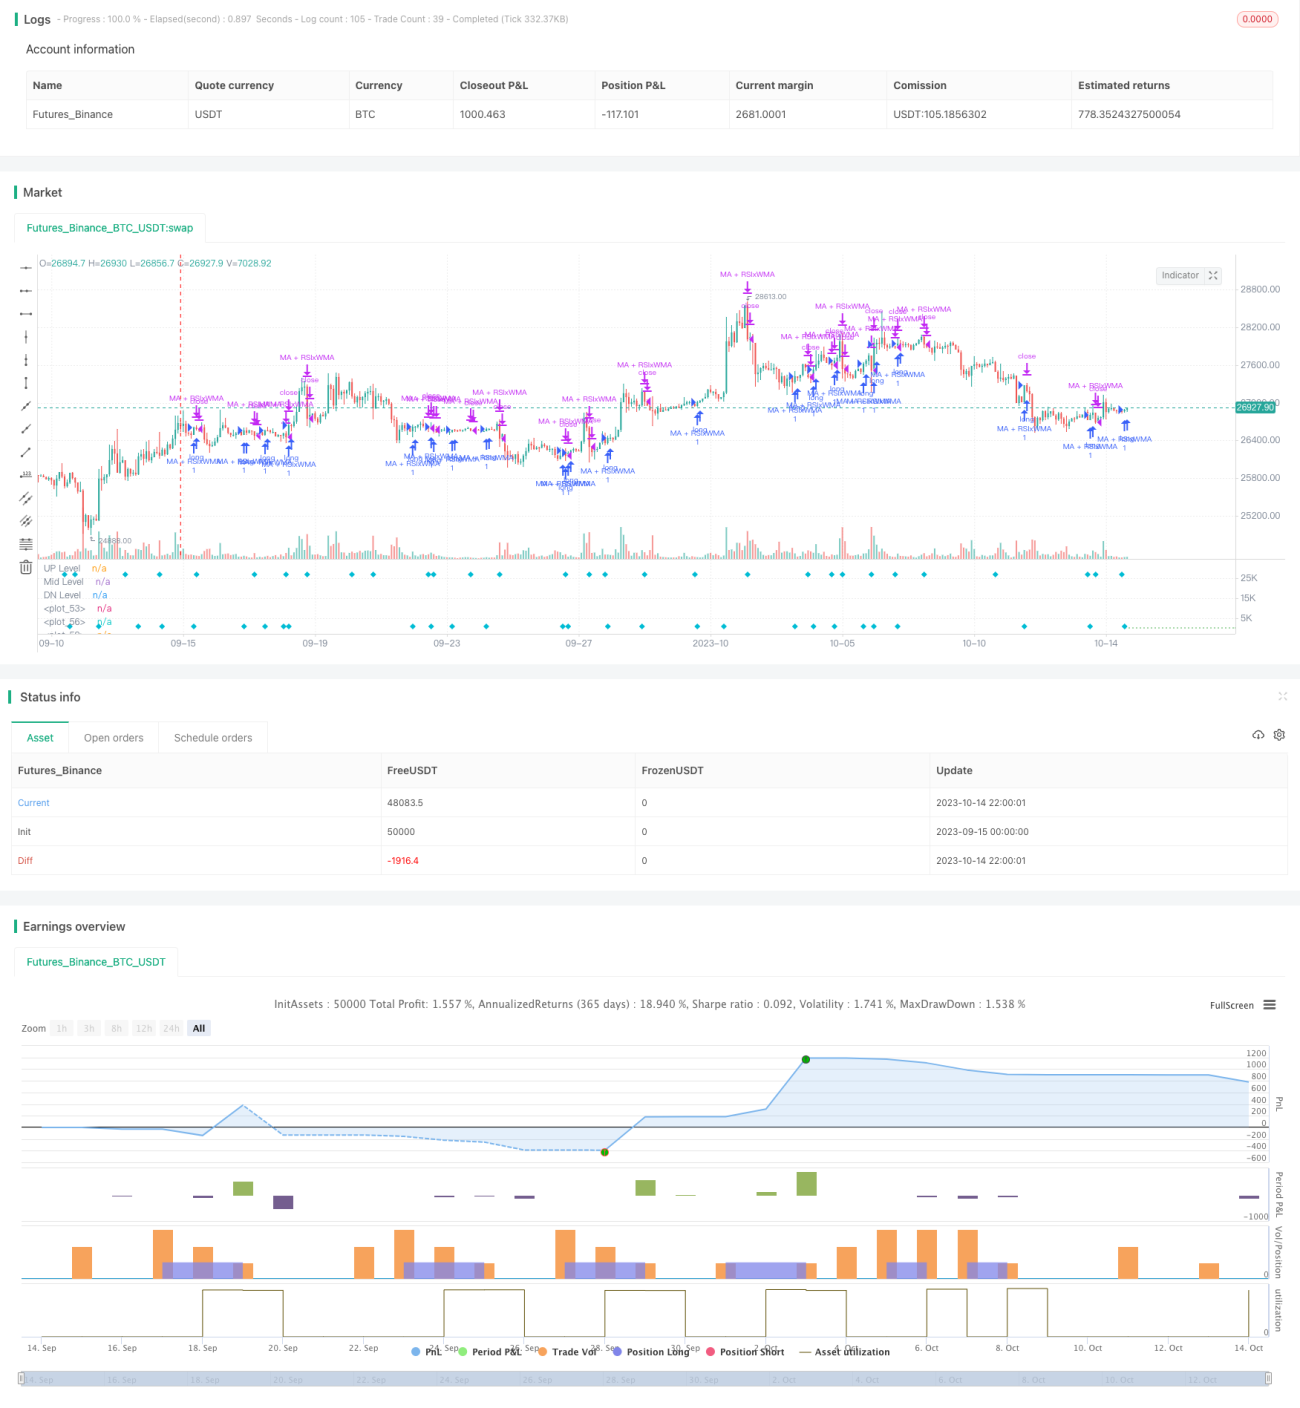
The core idea of this strategy is to identify trend reversal points by utilizing both Relative Strength Index (RSI) and moving averages of different timeframes, in order to capture mid-to-long term trends while conducting short-term trading. This strategy combines various trading signals in an attempt to improve trading success rate.
Strategy Logic
- Calculate RSI indicator, fast EMA and slow WMA moving averages.
- When RSI line crosses over WMA line, buy/sell signals are generated.
- When faster EMA crosses over slower WMA, buy/sell signals are generated.
- When both RSI and EMA cross over WMA simultaneously, strong buy/sell signals are generated.
- Additionally, when price crosses over auxiliary moving average lines, it strengthens the main signal.
- Set stop loss and take profit parameters.
This strategy combines breakout signals from multiple technical indicators and moving averages of different timeframes to identify trends of different periods, thereby improving reliability. RSI identifies overbought/oversold levels, EMA determines short-term trend, WMA determines medium-term trend, while price crossover with auxiliary moving averages verifies the trend. The combination of multiple signals enhances strategy performance.
Advantage Analysis
- Utilize RSI's reversal characteristic to capture reversal opportunities in overbought/oversold zones.
- Auxiliary moving averages act as trend filter to avoid false breakouts.
- Multi-timeframe combination enables tracking long-term trends while capturing short-term opportunities.
- Combining multiple indicator signals can improve trading success rate.
- Stop loss and take profit allows actively managing risks.
Risk Analysis
- RSI can generate false signals, needs filtering with moving averages.
- Rebounds under major trends may trigger reverse trade signals, need caution.
- Requires parameter optimization such as RSI period, moving average periods etc.
- Stop loss placement needs prudence to avoid being stopped out prematurely.
Risks can be mitigated through parameter optimization, strict stop loss strategy, and consideration of major trends etc.
Optimization Directions
- Optimize RSI parameters to find optimal period length.
- Test different moving average combinations.
- Incorporate volatility index like ATR for dynamic stop loss/take profit.
- Add position sizing and risk management modules.
- Utilize machine learning for parameter optimization and signal quality evaluation.
Summary
This strategy integrates trend following and extreme reversal trading ideas, adds multi-timeframe analysis and synthesized indicators, aiming to improve trading success rate. Key is to control risk, optimize parameters, and consider impacts of major trends. Overall this is a practical strategy with strong adaptability. More advanced techniques can be used to further improve strategy quality.
- 1