MACD Trend Balancing Strategy

Overview
This is a trend following strategy that identifies bullish and bearish directions using the MACD indicator. It generates the MACD main line by calculating the difference between fast and slow moving averages. The strategy uses the golden cross of the MACD main line and signal line to generate buy signals, and the death cross to generate sell signals, achieving balanced tracking of trends.
Strategy Logic
The code first sets the backtesting timeframe to test the historical performance of the strategy.
The MACD indicator is then calculated, including the length settings for the fast moving average, slow moving average, and MACD moving average. The fast line reacts more sensitively and the slow line reacts more steadily. Their difference forms the MACD main line, which is then smoothed by a moving average to form the MACD signal line. When the difference crosses above the zero line, a bullish signal is generated. When it crosses below, a bearish signal is generated.
Based on the bullish and bearish signals, record the last time when a signal was generated. When the fast and slow lines cross, confirm and record the buy/sell signals, then a position can be opened.
After entering a position, continuously track the highest and lowest price of the position. Set a stop loss percentage, when the loss reaches this percentage, exit with a stop loss.
Advantages
-
The MACD indicator can effectively identify trends and is one of the classic technical indicators.
-
The difference between fast and slow moving averages can early capture price momentum and direction changes.
-
The filtering effect of moving averages helps filter out some false signals.
-
The strategy incorporates a stop loss mechanism to control risks.
Risks
-
MACD is prone to generating false signals with limited optimization space.
-
Improper stop loss placement can be too active or conservative, requiring individual optimization across products.
-
Fixed position sizing can easily lead to overleveraging, consider position sizing based on account size.
-
The rationale for backtest timeframes needs to be validated to prevent overfitting.
Optimization
-
Optimize fast and slow moving average combinations to find best parameters fitting different products.
-
Add other indicators like candlesticks, Bollinger Bands, RSI to filter signals.
-
Evaluate different stop loss levels based on drawdown, Sharpe ratio.
-
Explore stop loss techniques like trailing stop loss, limit orders.
-
Test dynamic position sizing based on equity, volatility.
Conclusion
The MACD trend balancing strategy is based on the classic MACD indicator. It has the ability to sensitively capture price momentum and can be well-adapted to different products through parameter optimization. Further enhancements on filtering signals, stop loss techniques and dynamic position sizing can continue improving the stability and profitability.
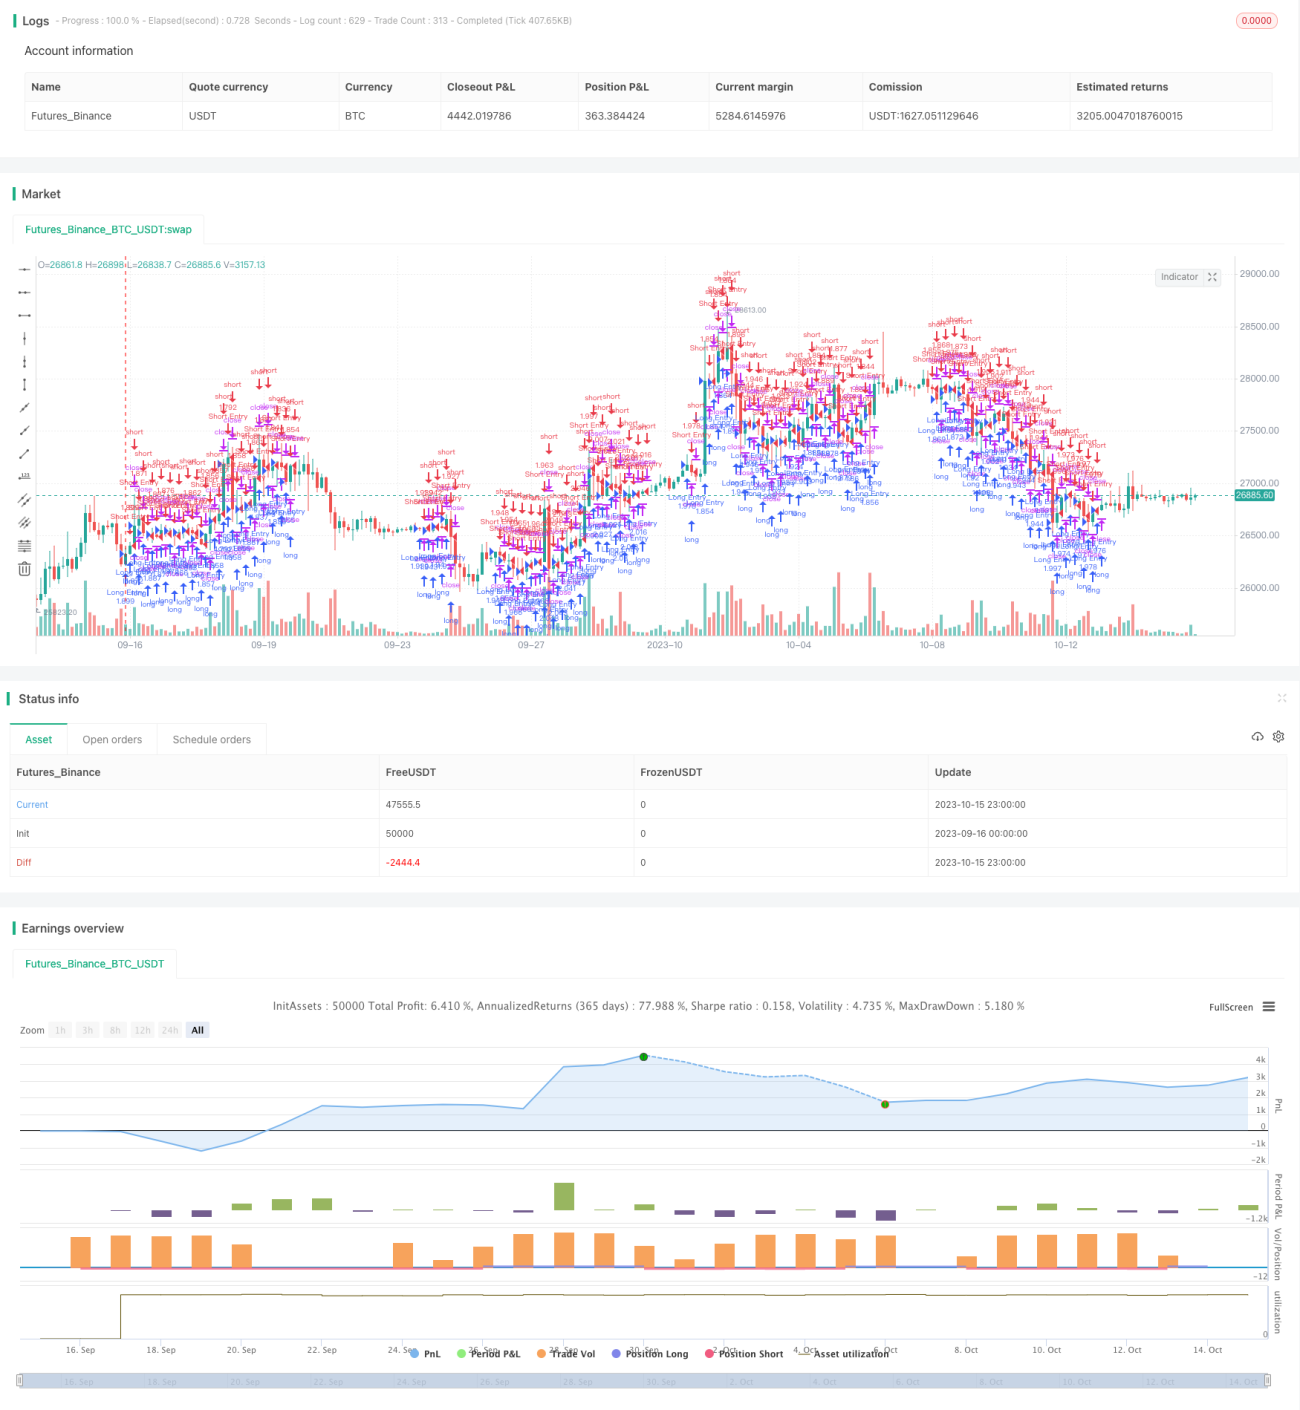
/*backtest
start: 2023-09-16 00:00:00
end: 2023-10-16 00:00:00
period: 3h
basePeriod: 15m
exchanges: [{"eid":"Futures_Binance","currency":"BTC_USDT"}]
*/

//@version=2
strategy("MACD BF", overlay=true, initial_capital=10000, default_qty_type=strategy.percent_of_equity, default_qty_value=100, commission_type=strategy.commission.percent, commission_value=0.0)

/////////////// Component Code Start ///////////////- 1