Heikin Ashi ROC Percentile Trading Strategy

Overview
This strategy is called the "Heikin Ashi ROC Percentile Trading Strategy". It aims to provide an easy-to-use trading framework based on the Heikin Ashi ROC and its percentiles.
Strategy Logic
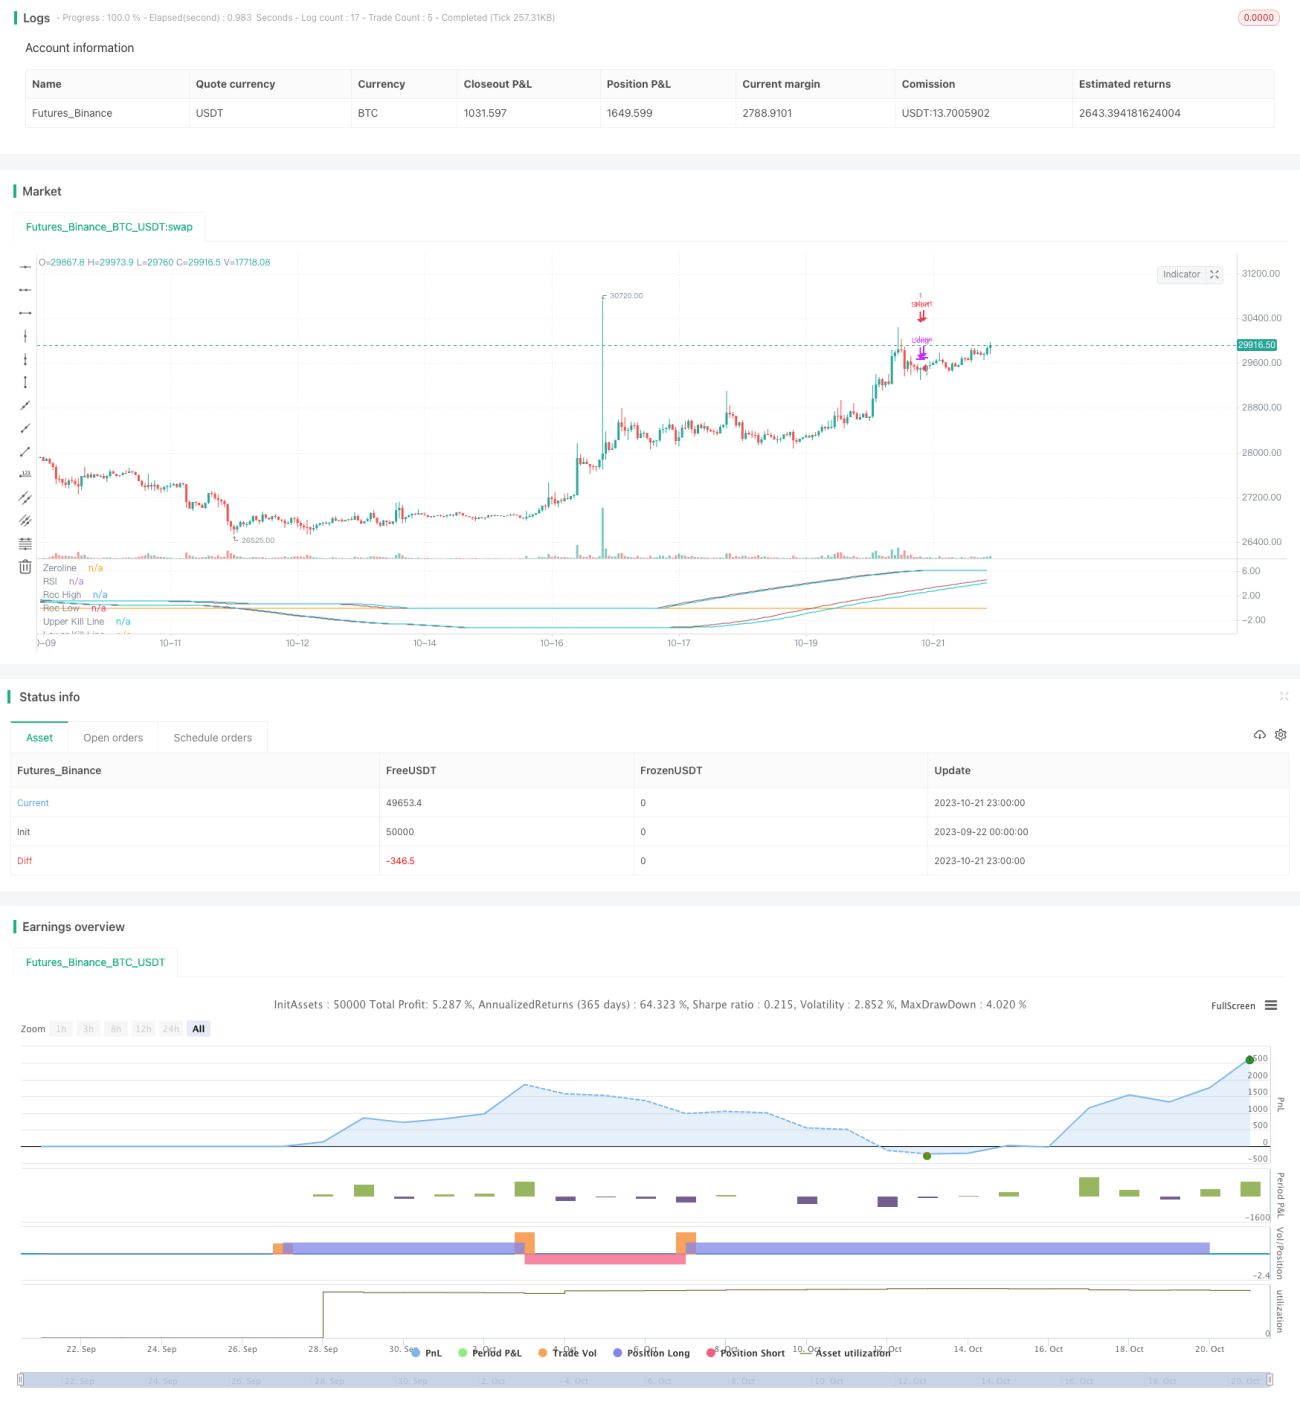
The strategy calculates the ROC of Heikin Ashi close prices over the past rocLength periods. It then calculates the highest rocHigh and lowest rocLow values of ROC over the past 50 periods. The upper rail upperKillLine and lower rail lowerKillLine are generated based on certain percentiles of rocHigh and rocLow. When ROC crosses above lowerKillLine, a long position is opened. When ROC crosses below upperKillLine, the long position is closed. Conversely, when ROC crosses below upperKillLine, a short position is opened. When ROC crosses above lowerKillLine, the short position is closed.
Advantage Analysis
The biggest advantage of this strategy is utilizing the ROC indicator's strong trend tracking capability, combined with Heikin Ashi's feature of smoothing price information. This allows the strategy to effectively identify trend changes and enter trades in a timely manner. Compared to simple moving averages, ROC responds more sensitively to price changes. Additionally, the upper and lower rails generated from percentiles can effectively filter out consolidations and avoid unnecessary trades from fake breakouts. Overall, this strategy combines both trend following and oscillation filtering to achieve good risk-reward ratios in major trends.
Risk Analysis
The main risk of this strategy is that improper parameter settings may lead to overtrading or insufficient sensitivity. The rocLength and percentile lookback periods need to be set prudently, otherwise the rails may become too dull or stiff, causing missed trades or unnecessary losses. In addition, the percentile settings need to be repeatedly backtested and adjusted for different markets to find optimal combinations. The strategy is also subject to certain losses when trends reverse, due to its reliance on trend-following indicators. Positions should be closed timely, or stop losses set to control risks.
Optimization Directions
The strategy can be optimized in the following ways: 1) Add filters with other indicators like RSI; 2) Dynamically optimize parameters with machine learning; 3) Set stop loss and take profit for automatic risk management; 4) Combine with non-trend strategies to balance risks.
Summary
In summary, this strategy utilizes the powerful trend tracking capability of the ROC indicator, combined with Heikin Ashi for trend identification and following. The upper and lower rails generated from ROC percentiles allow for effective loss filtering. This achieves good trend tracking performance. The advantages lie in its timely identification of trend changes and following of major trends, while filtering out consolidations with the rails. However, improper parameter settings may impact performance, and trend reversal risks remain. Further optimizing parameter selection and setting stops can help obtain more consistent results.
- 1