Trend Following Strategy Based on Moving Average Crossover

Overview
This strategy employs multiple technical indicators including moving averages and oscillators to identify price trends and reversal points for buy and sell signals.
Principles
The strategy consists of the following main components:
-
Timeframe Selection: Select the timeframe such as 1-min, 5-min etc for the candlestick chart.
-
Moving Average Selection: Configure parameters for commonly used moving averages like 10-day MA, 20-day MA etc.
-
Oscillator Selection: Configure parameters for oscillators like RSI, MACD, Williams %R etc.
-
Buy/Sell Signal Calculation: Custom functions are used to calculate values of moving averages and oscillators. Golden cross (shorter MA crossing above longer MA) generates buy signal while death cross (shorter MA crossing below longer MA) generates sell signal. Oscillators help identify overbought/oversold conditions.
-
Rating System: Each indicator generates a numerical score for buy/sell signal and a final rating index is calculated by taking average. Rating above 0 gives buy signal while rating below 0 gives sell signal.
-
Trade Signals: Final trade signals for long/short are generated based on the rating index being above or below 0.
The strategy combines multiple indicators to improve reliability of signals and identify trend reversals more accurately. Moving average crossover is an effective trend following technique and oscillators help avoid false signals. The rating system also provides clear buy/sell signals.
Advantages
-
Combines moving average crossover and multiple oscillators for more reliable signals and avoid false signals
-
Rating system provides clear buy/sell signals
-
Modular programming with custom functions improves code structure
-
Analyzes multiple timeframes for better accuracy
-
Optimized parameters like RSI length, MACD periods etc.
-
Customizable parameters provide flexibility to adjust indicators
Risks Involved
-
Individual stocks performance may diverge from broad market trend
-
High trading frequency increases costs and slippage risks
-
Parameters need continuous testing and optimization for different stock characteristics
-
Involves drawdowns and loss risks
Risks can be reduced through:
-
Stock selection based on market conditions
-
Adjusting holding period to lower trading frequency
-
Optimizing parameters based on stock specifics
-
Using stop loss to control losses
Enhancement Opportunities
The strategy can be further improved in the following ways:
-
Adding more indicators like volatility indices to strengthen signals
-
Automated parameter optimization using machine learning
-
Incorporating stock/sector selection filters
-
Combining with quantitative stock selection
-
Using adaptive stop loss, trailing stop loss etc.
-
Considering overall market conditions to avoid uncertainty
-
Adjusting rating weights based on real trading outcomes
In summary, the strategy integrates moving average crossover and multiple oscillators to effectively identify trends. But constant testing and risk control is required. Future enhancements can focus on portfolio selection, parameter optimization, stop loss etc.
Conclusion
The strategy uses moving average crossover as the primary signal along with oscillator confirmation, and generates clear buy/sell signals through the rating system. It can effectively identify trends and reversals but requires controlling trading frequency and risks. There is scope for continuous parameter optimization. The strategy has practical value and room for improvements.
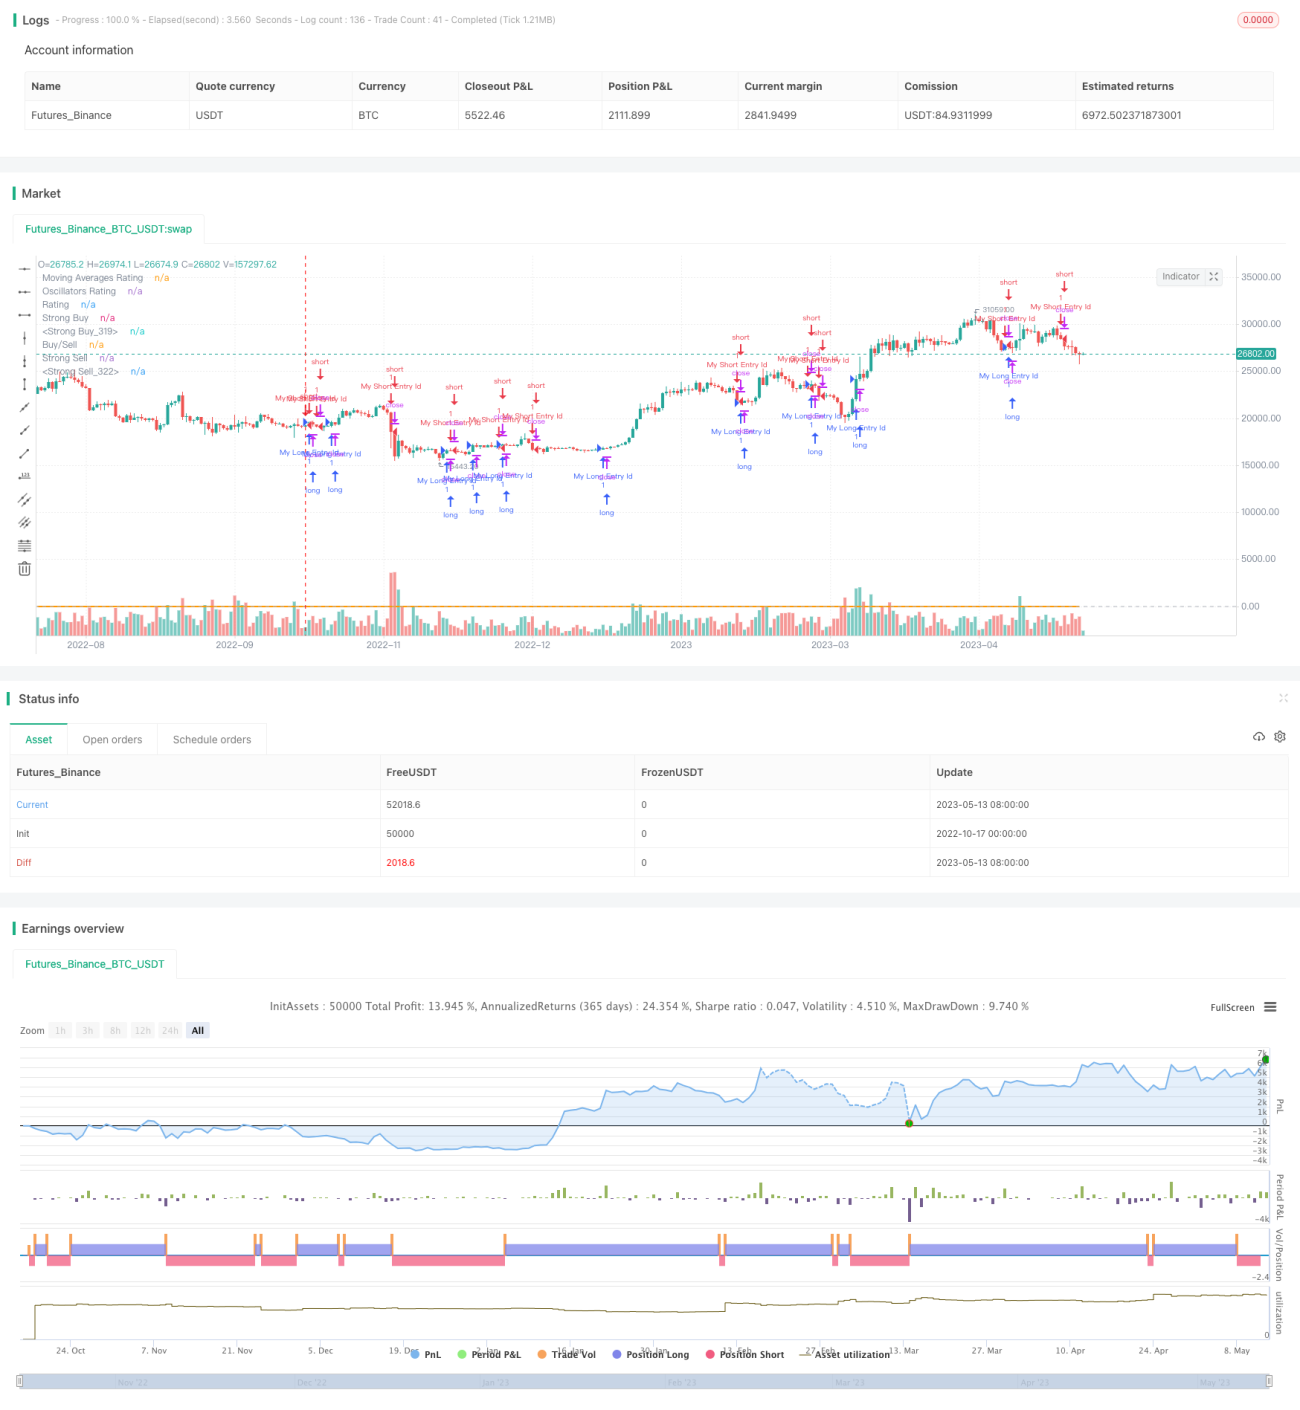
/*backtest
start: 2022-10-17 00:00:00
end: 2023-05-14 00:00:00
period: 1d
basePeriod: 1h
exchanges: [{"eid":"Futures_Binance","currency":"BTC_USDT"}]
*/

//@version=4
strategy("TV Signal", overlay=true, initial_capital = 500, currency = "USD")

// -------------------------------------- GLOBAL SELECTION --------------------------------------------- //- 1