Fibonacci Moving Averages Input Strategy

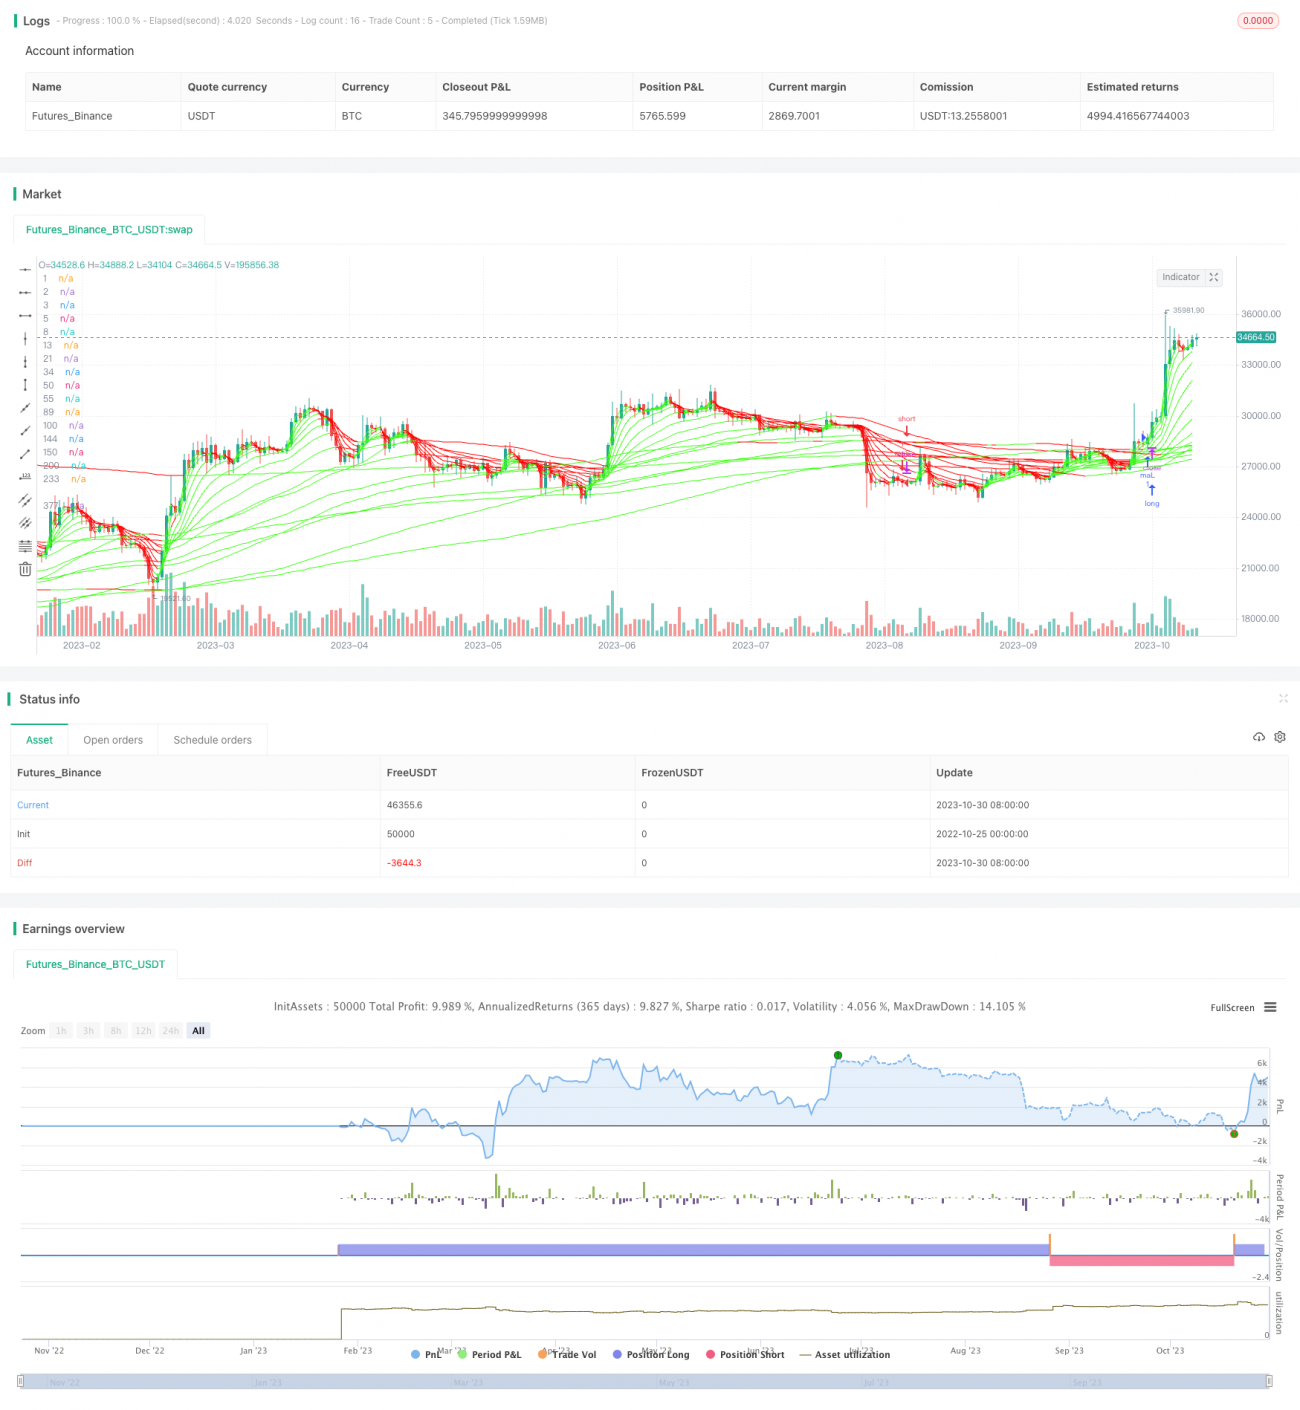
Overview
The Fibonacci Moving Averages Input strategy is based on moving average crossover or crossunder signals to generate trading signals. When the short-term moving average crosses above the long-term moving average, a bullish golden cross signal is generated. When the short-term moving average crosses below the long-term moving average, a bearish death cross signal is generated. The commonly used moving averages are the 50-day and 200-day moving averages.
The Fibonacci Moving Averages Input (FibMAI) strategy allows you to choose any value for your bullish or bearish crosses. For visual display, I have plotted Fibonacci moving averages including 1, 2, 3, 5, 8, 13, 21, 34, 55, 89, 144, 233, 377, 610, 987 while hiding the candlesticks. But to use this indicator, I only enable a couple of MA's to check if there's a notable crossover or crossunder pattern, then backtest those values into the FibMAI strategy Long or Short settings input.
For example, the Long or Short settings input for this NQ1! day chart is:
Bullish =
FibEMA34
crossover
FibEMA144
Bearish =
FibEMA55
crossunder
FibSMA144
As you can see, you can mix and match 4 different MA values, either Exponential or Simple.
Default color settings:
Rising value = green color
Falling value = red color
Default Visual FibMA settings:
FibEMA 1, 2, 3, 5, 8, 13, 21, 34, 55, 89, 144, 233, 377, 610, 987, 1597, 2584, 4181
Default Visual MA settings:
SMA 50, 100, 150, 200
Default Long or Short settings:
Bullish =
FibEMA34
crossover
FibEMA144
Bearish =
FibEMA55
crossunder
FibSMA144
Principle
The core logic of this strategy is based on crossover signals between two moving averages to generate trading signals.
Moving averages are technical indicators used to analyze market trends. They calculate the average closing price over a certain period and can effectively filter market fluctuations. There are two types of moving averages - Simple Moving Average (SMA) and Exponential Moving Average (EMA).
SMA is the simple arithmetic average of closing prices over a period. EMA applies exponential smoothing to closing prices, giving more weight to recent prices. EMA reacts more quickly to price changes.
When the short-term moving average crosses above the long-term moving average, it signals a bullish trend change and generates a buy signal. This is called a "golden cross". Conversely, when the short-term moving average crosses below the long-term moving average, it signals a bearish trend change and generates a sell signal. This is called a "death cross".
The flexibility of this strategy lies in the ability to manually set the parameters for the 4 moving averages. The default parameters are 34-period EMA crossing above 144-period EMA for bullish signal, and 55-period SMA crossing below 144-period EMA for bearish signal. These parameters can be freely adjusted in the input boxes.
In addition, the strategy plots multiple Fibonacci sequence moving averages across different timeframes. Common moving averages like 50-day, 100-day, 150-day and 200-day are also plotted. These serve as references, while the key is the crossover moving averages entered in the Long/Short settings.
Advantages
The advantages of this moving average crossover strategy include:
-
Using moving averages filters market noise and identifies trend direction
-
Crossover signals have a certain degree of reliability
-
Customizable long and short moving average combinations for parameter optimization
-
Incorporates multiple timeframes to identify trends
-
Can use both EMA and SMA based on instrument characteristics
-
Visually intuitive with colored moving average crosses
-
Simple to understand and suitable for beginners
-
Flexibly applied across different instruments with universality
Risks
There are also some risks to this strategy:
-
Too many whipsaw signals during choppy markets, leading to over-trading
-
Incorrect signals if unsuitable moving average combinations are used
-
Lag in signals during extreme trend reversals, unable to reflect price changes in time
-
Moving average crosses do not completely avoid losses, need reasonable stop loss
-
Over-optimization causing curve fitting. Parameters need to be robust across market cycles.
-
Parameters may need fine-tuning for different instruments
Optimization Directions
Some ways to optimize this strategy:
-
Test different long and short moving average combinations to find optimal parameters using backtesting
-
Try adjusting moving average types, compare SMA and EMA performances. Use SMA for instruments with clearer trends, and EMA for more volatile instruments.
-
Incorporate other indicators like KDJ, MACD to filter false signals and improve quality
-
Add stop loss strategies to control loss on single trades, such as trailing stop loss
-
Optimize money management strategies, like adjusting position sizing based on drawdown
-
Test parameter stability across different instruments and timeframes to evaluate robustness
Conclusion
Overall, the Fibonacci Moving Averages Input strategy is a reliable trend following system. It uses simple and intuitive moving average crosses for trade signals, and can be adapted to different instruments through parameter optimization. With proper stop loss and money management, risks can be controlled. Over-optimization and lagging trend reversal signals should be avoided. With well-chosen parameters and trading discipline, this can be an efficient and stable profit-generating strategy.
/*backtest
start: 2022-10-25 00:00:00
end: 2023-10-31 00:00:00
period: 1d
basePeriod: 1h
exchanges: [{"eid":"Futures_Binance","currency":"BTC_USDT"}]
*/

//@version=5
// This source code is subject to the terms of the Mozilla Public License 2.0 at https://mozilla.org/MPL/2.0/
// © Options360 : Fibonacci MAI (Moving Averages Input) beta 10/15/22
// © Options360 original public release = 2/25/23- 1