Trend Line Trading Strategy

Overview
This strategy is based on the idea of breaking through key support and resistance levels by identifying key uptrend and downtrend lines in price charts and trading when the price breaks through trend lines. The strategy is simple and reliable, suitable for market environments with clear trends.
Strategy Principle
The strategy identifies key high and low points to obtain support and resistance lines by calculating the highs and lows of the left and right bar lines. Specifically:
-
Use
pivothigh()andpivotlow()functions to detect key highs and lows. -
Derive equations for support and resistance lines based on highs and lows.
-
Go long when the price breaks above resistance; go short when the price breaks below support.
-
Choose long or short based on trend direction.
-
Option to reverse position directly when breakout occurs.
-
Option to use stop loss, take profit, trailing stop loss.
-
Option for swing point stop loss, ATR stop loss, fixed stop loss.
The strategy trades simply based on trend line breakouts, balancing trend following and reversal, simple and practical.
Advantage Analysis
-
The strategy is relatively simple, easy to understand and implement.
-
Utilizes breakout theory, has some probability edge.
-
Can set stop loss and take profit to control risk.
-
Can implement trend following or reversal.
-
Optimizable parameters suit different market environments.
Risk Analysis
-
Breakout signals may have false signals.
-
Improper stop loss placement may increase losses.
-
Reversal trades risk being trapped.
-
Parameter tuning needs experience, improper settings may fail.
-
Pure trend breakout not suitable for range-bound market.
Risks can be reduced via optimizing stop loss strategy, evaluating signal quality, assessing reversal timing etc.
Optimization Directions
-
Evaluate breakout signal reliability to improve accuracy.
-
Incorporate volume to strengthen signals.
-
Optimize stop loss for market volatility.
-
Assess optimal reversal timing.
-
Parameter tuning.
-
Evaluate multifactor models.
-
Evaluate combining with other indicators.
Summary
The strategy is simple and practical overall, capturing price trends through simple trend breakouts and manageable risks. It can be optimized across multiple dimensions to suit more market conditions, an very practical trend following strategy overall.
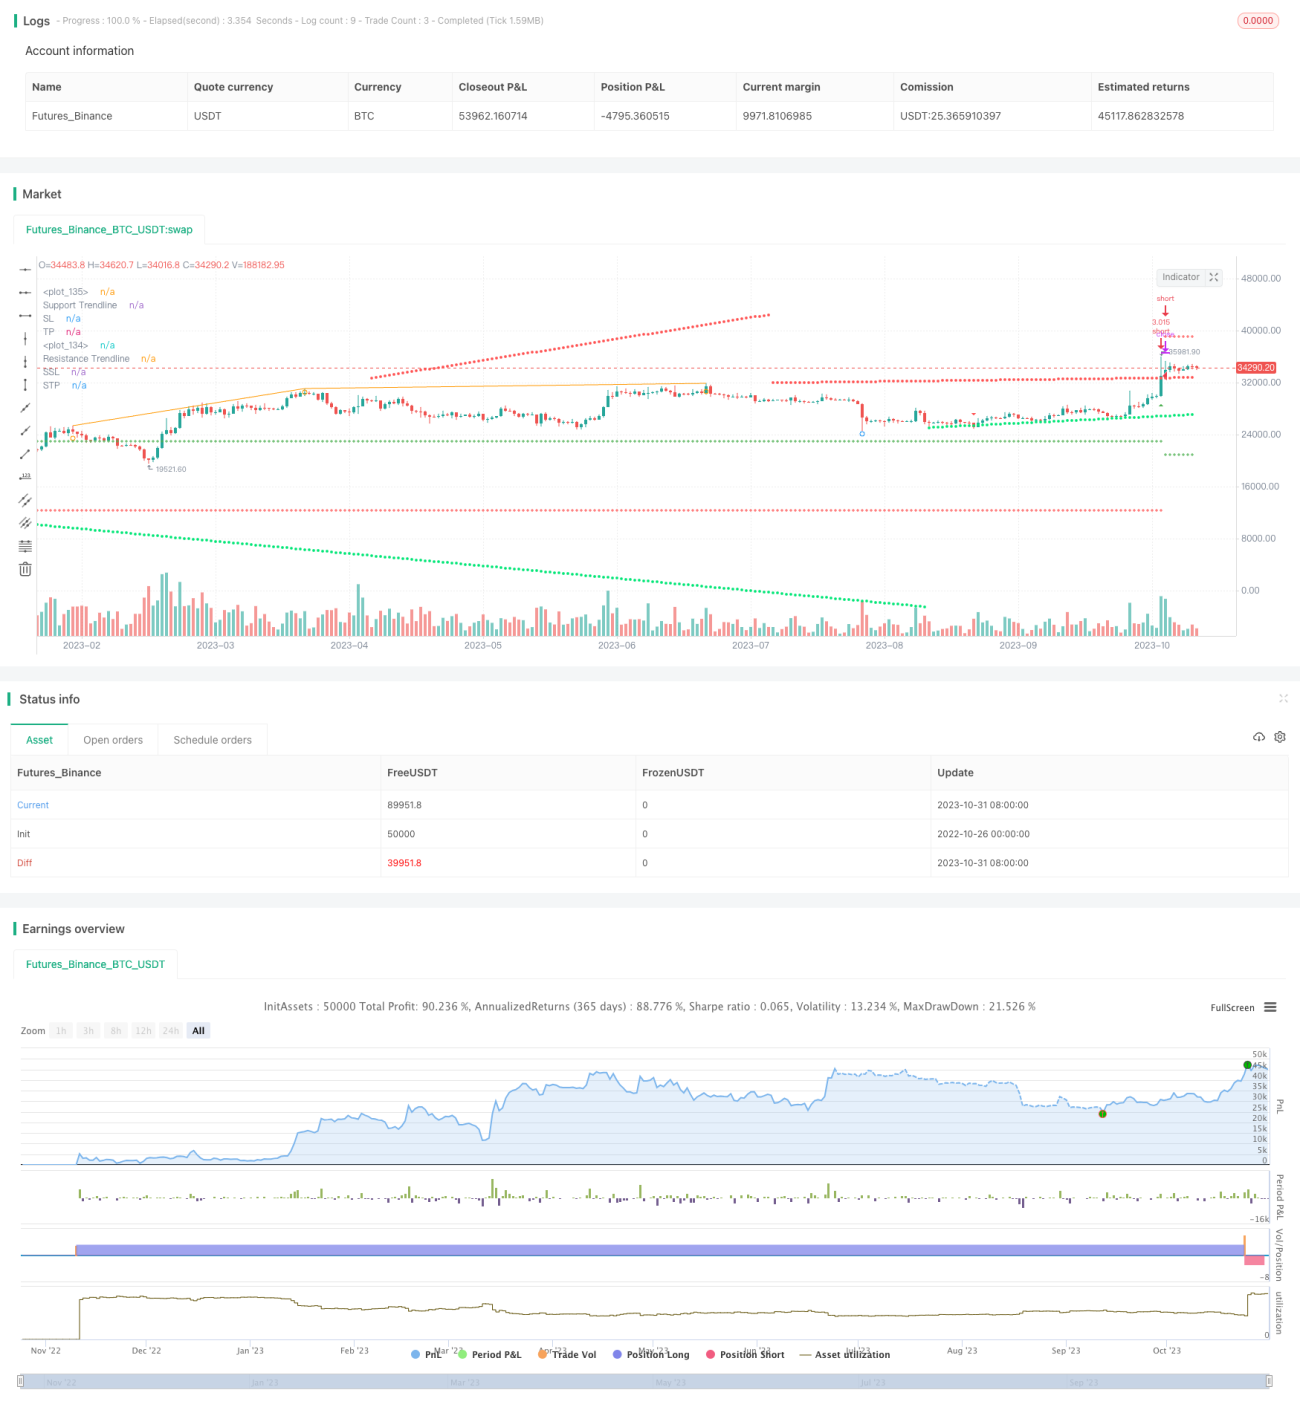
/*backtest
start: 2022-10-26 00:00:00
end: 2023-11-01 00:00:00
period: 1d
basePeriod: 1h
exchanges: [{"eid":"Futures_Binance","currency":"BTC_USDT"}]
*/

// This source code is subject to the terms of the Mozilla Public License 2.0 at https://mozilla.org/MPL/2.0/
// © tweakerID and © BacktestRookies

// Using the clever calculations and code by BacktestRookies, here is a strategy that buys - 1