Keltner Channel Trend Based Strategy

Overview
This strategy is based on three main indicators: trend indicator, Keltner Channel and DM indicator.
The trend indicator consists of SMA and EMA. Keltner Channel is used to determine the open and close price of candles. DM indicator is for judging the direction of long and short.
The entry signal is triggered when:
- EMA crosses over SMA, confirming uptrend
- Candle opens above the upper band and closes inside the channel
- DM indicator is above the benchmark
The strategy has two take profit levels and one stop loss level. Trailing stop can be used for optimizing profits.
Strategy Principles
Trend Identification
SMA and EMA crossovers are used to determine the trend direction. EMA (46) crossing over SMA (46) indicates an upward trend.
Keltner Channel
The channel has three lines: middle, upper and lower. The middle line is SMA of close price with length of 81. The upper and lower bands are placed at a multiple of true range above and below the middle line. Here we use 2.5 times of true range.
Keltner Channel shows support and resistance levels. Price movements in relation to the channel are analyzed.
DM Indicator
DM indicator contains ADX, +DI and -DI. +DI measures uptrend strength while -DI measures downtrend strength. ADX shows the trend strength.
Here ADX (10), DI (19) are used. When +DI crosses above the benchmark (default 27), it signals strong uptrend and good for long entry.
Advantage Analysis
This strategy combines trend, channel and momentum indicators to effectively determine price actions and long/short direction. The advantages are:
-
Trend identification is relatively accurate to avoid counter trend trades.
-
Keltner Channel shows clear support and resistance levels.
-
DM indicator measures long/short momentum to ensure direction.
-
Strict entry rules help filter false breakouts.
-
Take profit and stop loss points allow capturing profits.
Risk Analysis
There are also some risks to consider:
-
Trend may reverse when EMA crosses below SMA, so exit timely.
-
Channel can fail in strong trends, not strict support/resistance.
-
DM may generate false signals, check price action.
-
False breakout may trigger entry but quickly fallback, use reasonable stop loss.
-
Take profit and stop loss need continuous optimization to adapt to changing market conditions.
Optimization Directions
Some ways to further optimize the strategy:
-
Adjust parameters and test different trend identification methods.
-
Optimize channel parameters to better fit true range.
-
Test different DM parameters and find the optimal combination.
-
Add more entry filters like volume.
-
Try trailing stop loss for getting more profits.
-
Test separately for different products to find best parameter sets.
Conclusion
The strategy integrates multiple indicators for determining trend, support/resistance and momentum, which allows effectively catching trends and controlling risks. But risks need to be noticed and parameters require optimization as market changes. Overall, this is a strategy with strong practicality.
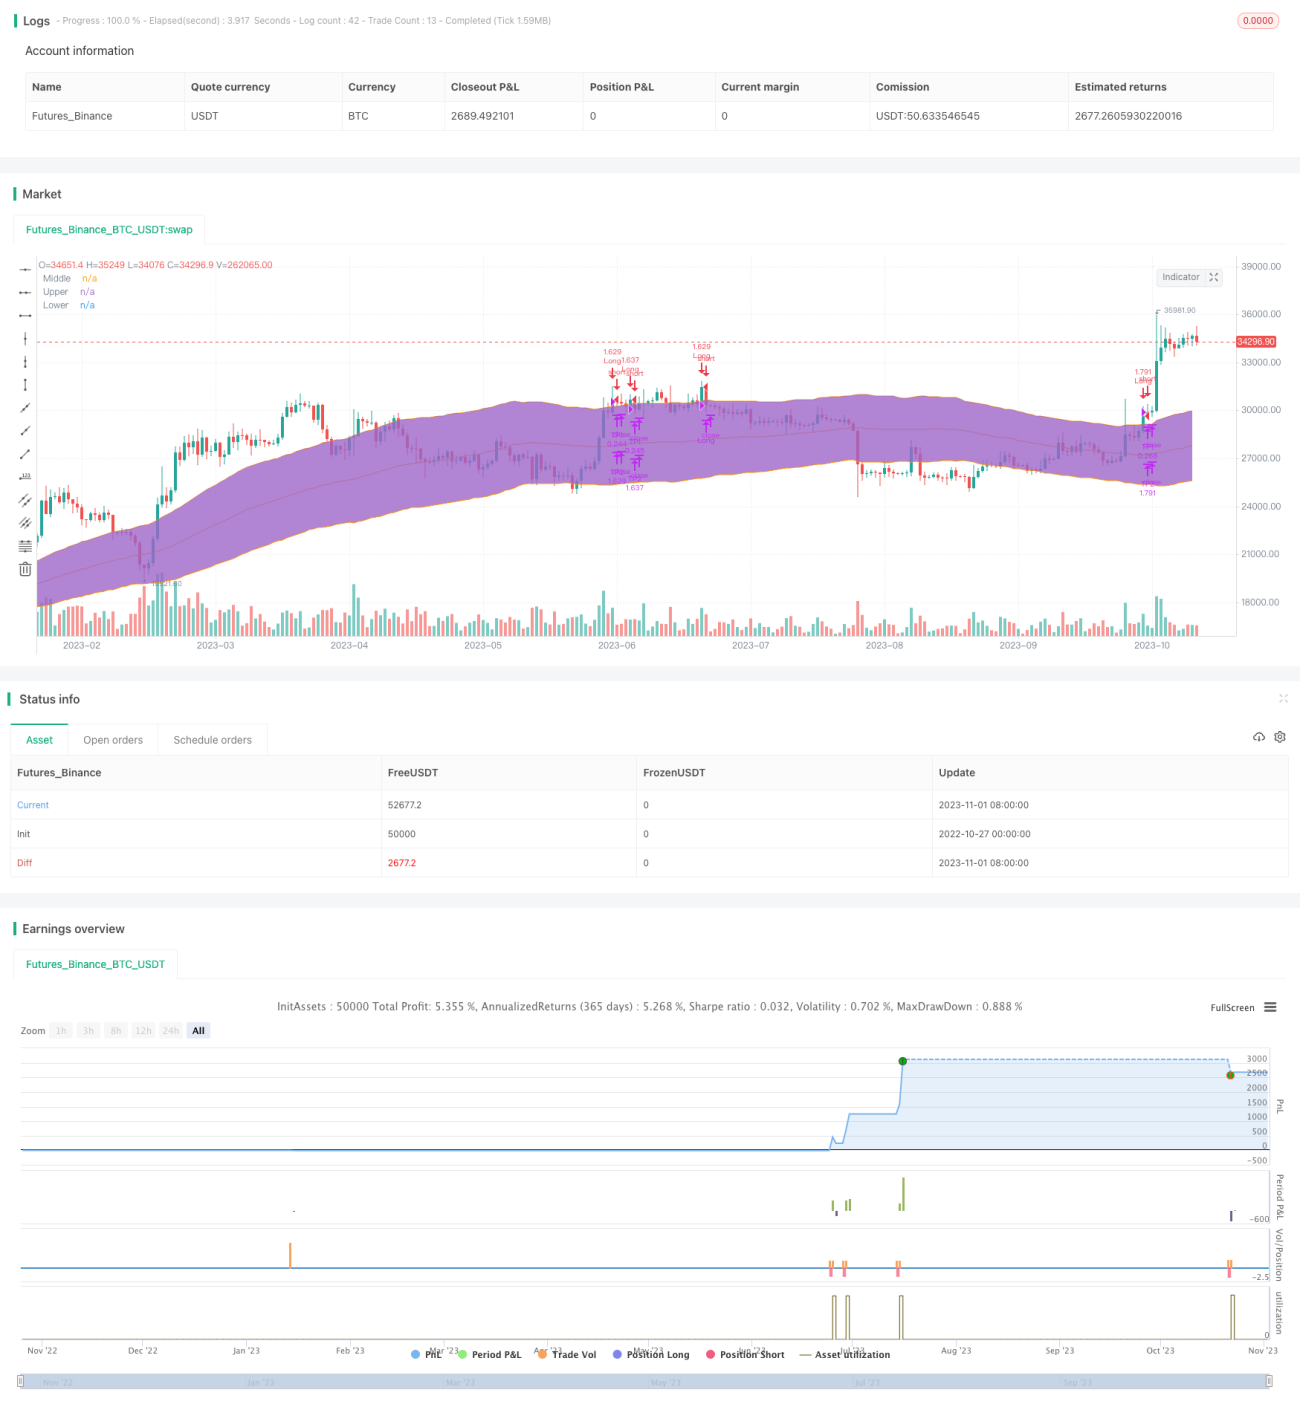
/*backtest
start: 2022-10-27 00:00:00
end: 2023-11-02 00:00:00
period: 1d
basePeriod: 1h
exchanges: [{"eid":"Futures_Binance","currency":"BTC_USDT"}]
*/

//Original Idea by: Wunderbit Trading

//@version=4
strategy("Keltner Channel ETH/USDT 1H", overlay=true, initial_capital=1000,pyramiding = 0, currency="USD", default_qty_type=strategy.percent_of_equity, default_qty_value=100, commission_type=strategy.commission.percent,commission_value=0.07)- 1