Multi-Timeframe RSI Moving Average Crossover Strategy

Overview
The Multi-Timeframe RSI Moving Average Crossover Strategy is a trend following strategy across multiple timeframes. It uses RSI indicators on multiple timeframes and takes a weighted moving average of each timeframe's RSI. The final signals are generated by combining all RSI moving averages into two comprehensive indicators and trading the crossover signals, which is a typical dual moving average crossover system.
Principles
This strategy first calculates RSI indicators on multiple timeframes (1-min, 5-min, 15-min, etc). Then it takes 15-period VMA (weighted moving average) of the RSI for each timeframe to get the RSI moving average lines.
After that, all the RSI moving averages from different timeframes are combined equally into two signals - fast line and slow line. The fast line is a 100-period EMA and the slow line is a 150-period EMA.
When the fast line crosses above the slow line, a buy signal is generated. When the fast line crosses below the slow line, a sell signal is generated. By combining multi-timeframe RSI in this way, the crossover signals can effectively track trends while filtering out short-term market noise.
Advantages
-
Combining multiple timeframes can smooth price curves and avoid false breakouts effectively.
-
RSI indicates overbought/oversold levels, avoiding chasing new highs/lows.
-
Dual moving averages have better holding effect than a single moving average system.
-
Using VMA instead of SMA reduces the impact of short-term fluctuations.
Risks
-
Multi-timeframe strategies require extensive parameter tuning, improper settings may cause missing good entries or late entries.
-
Moving averages have poor curve fitting, underperform at trend turning points.
-
RSI divergence happens frequently, reversal signals should be watched.
Solutions: Optimize timeframe parameters; Combine with other indicators like MACD to determine trends; Watch out for RSI divergence signals.
Optimization Directions
-
Optimize the number of timeframes and parameter settings to better capture trends.
-
Consider adding stop loss to control risks.
-
Combine other indicators for better decision on trends and divergences.
-
Test different holding period parameters for best holding effect.
Conclusion
The Multi-Timeframe RSI Moving Average Crossover Strategy generates trading signals by combining RSI indicators from multiple timeframes using a moving average system, which is a typical multi-timeframe trend following strategy. Its strength lies in effectively tracking trends and filtering out noise, but parameter tuning and risk control need attention. With further optimization, it can become a robust trend following system.
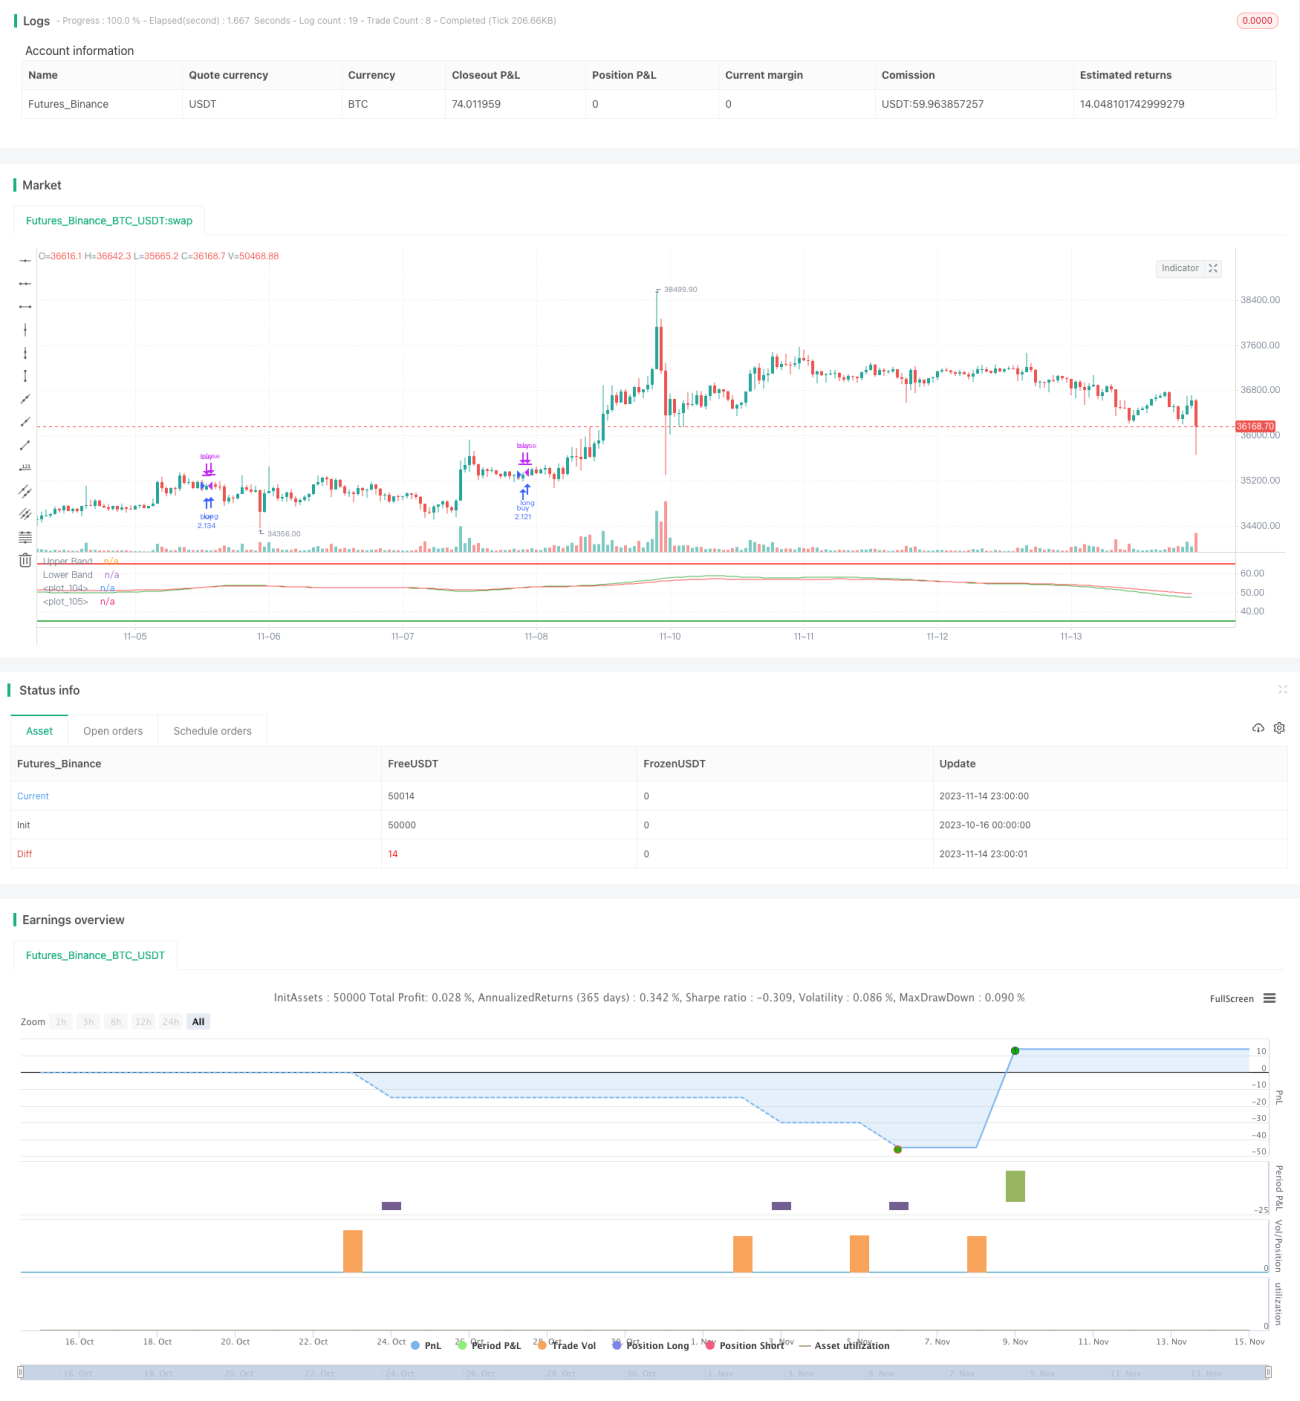
/*backtest
start: 2023-10-16 00:00:00
end: 2023-11-15 00:00:00
period: 1h
basePeriod: 15m
exchanges: [{"eid":"Futures_Binance","currency":"BTC_USDT"}]
*/

//@version=4
strategy(title="RSI multitimeframe SMA crossover", shorttitle="RSI multitimeframe strategy", default_qty_type= strategy.percent_of_equity, margin_long=50, default_qty_value=150)

res1 = input(title="Res 01", type=input.resolution, defval="1")- 1