Dual Moving Average Crossover Momentum Strategy

Overview
This strategy utilizes the dual moving average crossover principle, combines the MACD indicator for trend judgment and cross background highlighting, and confirms entries with pattern dots, aiming to capture mid-term trends in the market. The main logic is to enter when the direction of the moving averages changes, stand out cross points with MACD background colors, and determine momentum by the change in MACD histogram colors.
Strategy Logic
The strategy builds dual moving averages using fast EMA and slow EMA, and determines the trend direction based on the crossover between the fast and slow lines. It also calculates the MACD and Signal, and plots their difference as a histogram.
According to the code, the fast line length is 12 and the slow line length is 26, representing short-term and long-term trends. The Signal length is 9 for additional smoothing.
Crossover logic:
-
trend_up = macd > signal: fast line crosses above slow line, indicating short-term uptrend
-
trend_dn = macd < signal: fast line crosses below slow line, indicating short-term downtrend
Crossover point detection:
-
cross_UP = signal[1] >= macd[1] and signal < macd: fast line crosses slow line from below
-
cross_DN = signal[1] <= macd[1] and signal > macd: fast line crosses slow line from above
Histogram color change determines momentum strength:
-
histA_IsUp = Histogram column growing and greater than 0, momentum strengthening in uptrend
-
histA_IsDown = Histogram column declining but still greater than 0, momentum weakening in uptrend
-
Same logic below 0
Advantages
-
Dual moving averages determine mid-term trend, avoid short-term noise
-
MACD assists in judging short-term trends and momentum for higher profitability
-
Histogram color change helps identify better entry timing
-
Crossover background color highlights signals
-
Customizable moving average periods suit different market environments
-
Adjustable MACD parameters optimize the indicator
-
Provides multiple entry confirmations: trend, crossover, pattern breakout
Risks
-
Dual MAs insensitive to short-term fluctuations, may miss short-term opportunities
-
Poor MACD effect with improper parameter settings, may generate false signals
-
Entries based solely on MAs and MACD have some blind spots
-
No stop loss mechanism results in risk of expanding losses
-
Lack of strict money management and position sizing
Possible solutions:
-
Combine other indicators to define short-term swing ranges and control risk
-
Optimize MACD parameters and test on different markets
-
Add pattern, momentum etc. to confirm signals
-
Establish stop loss mechanisms to limit loss size
-
Add money management module to size positions based on capital
Optimization Directions
-
Test and optimize MA parameter combinations for more market adaptability
-
Try different MA types like VWAP, Bollinger midline etc.
-
Consider trading volume to avoid false breakouts
-
Incorporate RSI etc. to confirm overbought/oversold
-
Build robust stop loss mechanisms like trailing stop, volatility stop etc.
-
Incorporate position sizing based on account size
-
Consider machine learning for parameter optimization
-
Expand strategy universe for enhanced portfolio approach
Conclusion
This strategy integrates dual moving average trend filtering and MACD momentum, adds pattern features, building a relatively stable mid-term trading system. The key advantage lies in capturing the major trend while avoiding short-term noise. But there are also areas that could be improved, like adding stop loss mechanisms and risk management. Overall this serves as a valuable conceptual example, but requires comprehensive testing and refinements for live trading.
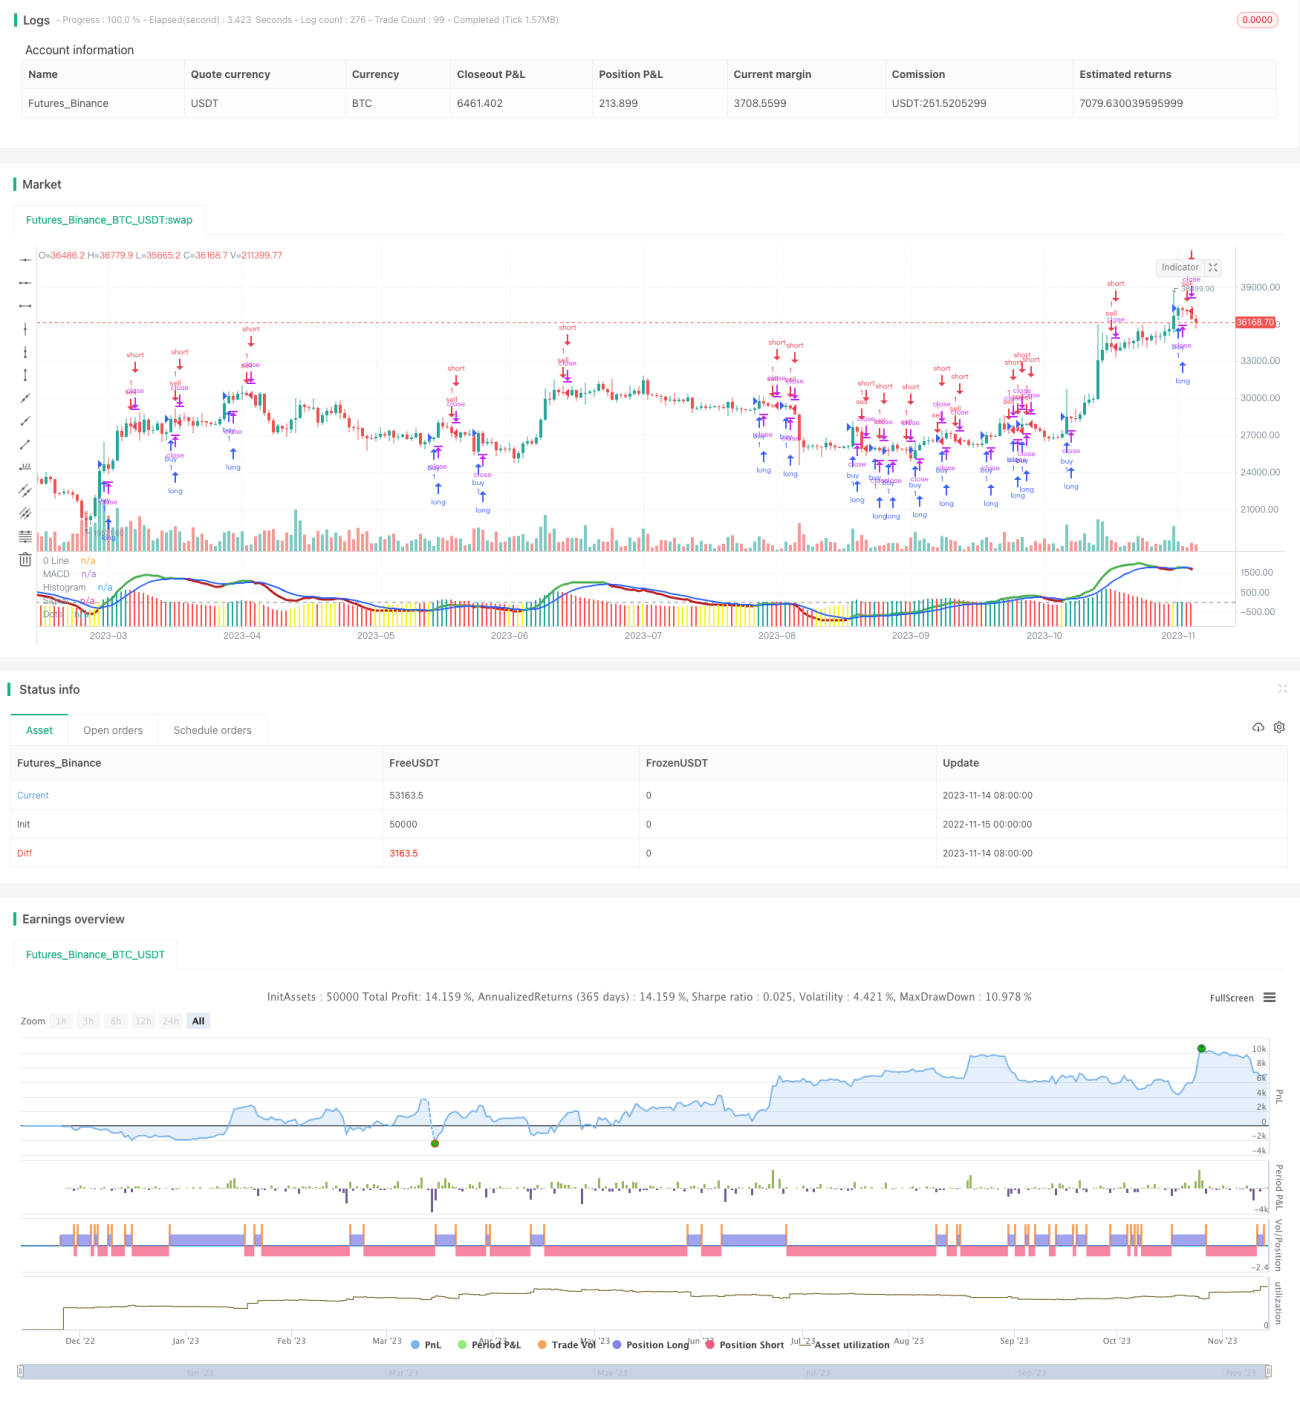
/*backtest
start: 2022-11-15 00:00:00
end: 2023-11-15 00:00:00
period: 1d
basePeriod: 1h
exchanges: [{"eid":"Futures_Binance","currency":"BTC_USDT"}]
*/

//@version=5
strategy(title="Histogram MacD MVP_V2.1", shorttitle="Histogram MacD MVP_2.1")
//Plot Inputs
res = input.timeframe("", "Indicator TimeFrame")- 1