Golden Cross with Bollinger Bands Momentum Strategy

Overview
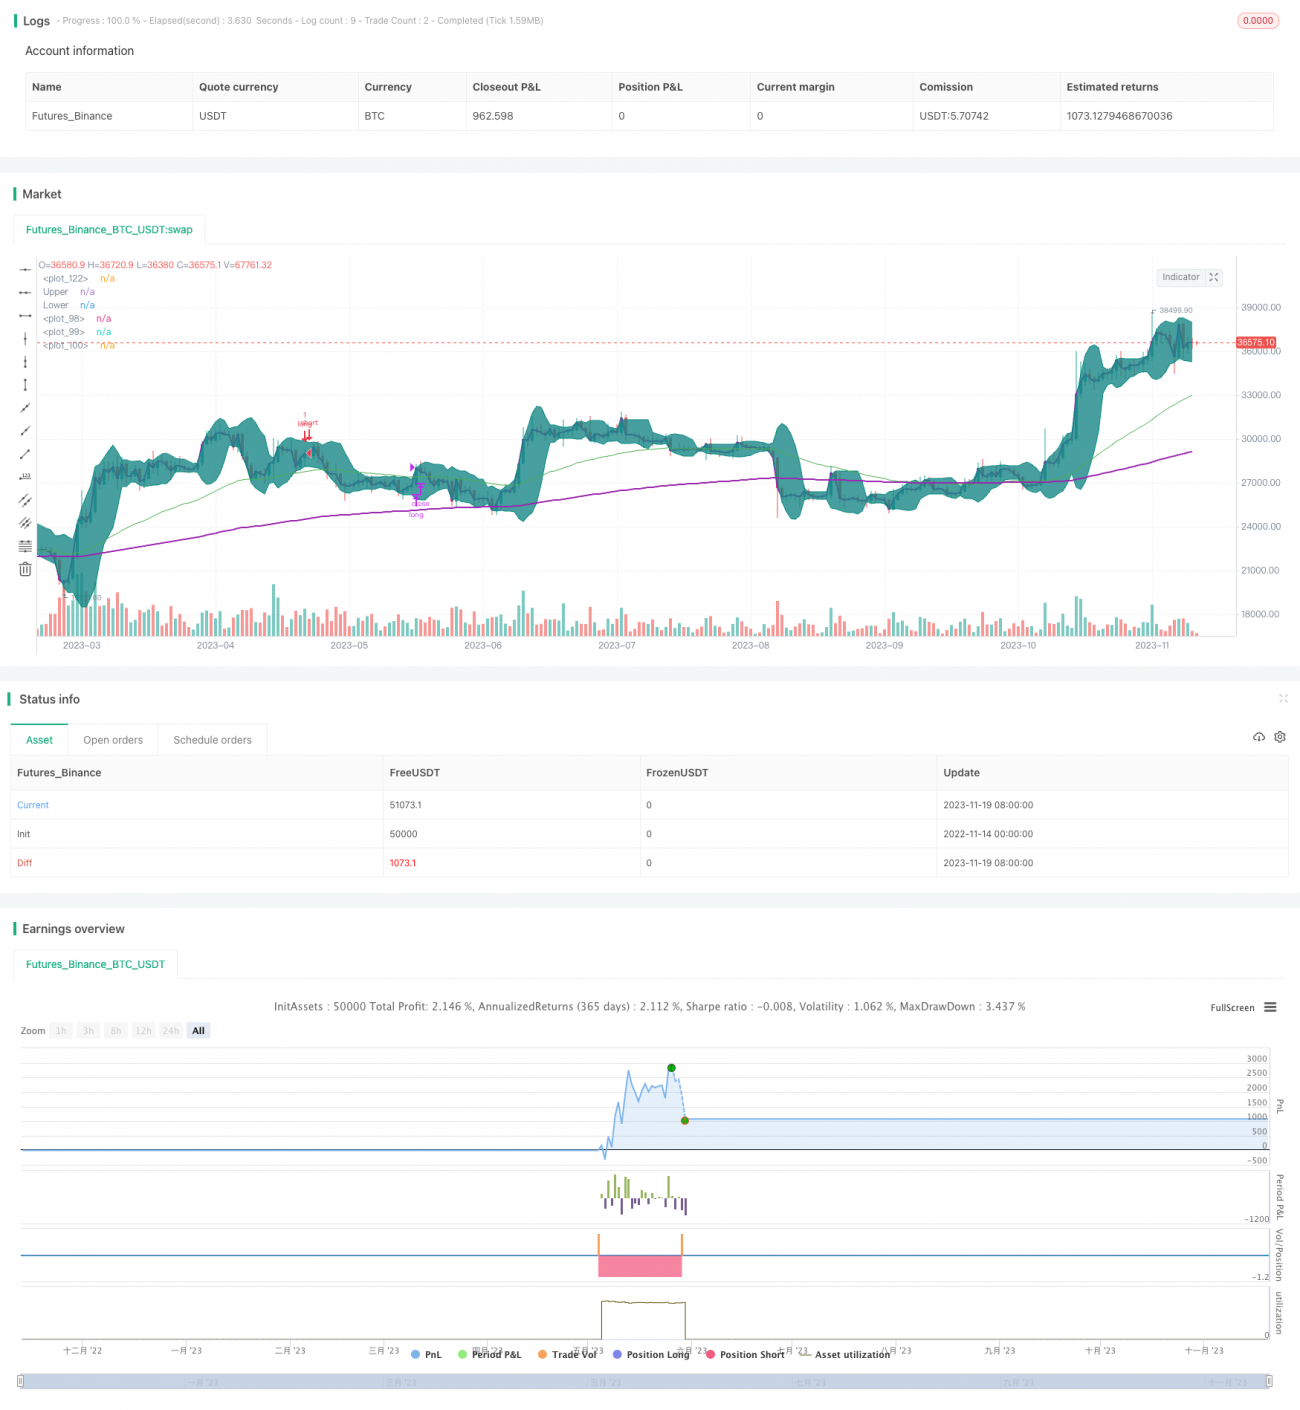
This strategy combines moving average, Bollinger bands and volume weighted average price (VWAP) indicators. It enters long positions when the golden cross forms and the fast moving average breaks above the slow one. The strategy also utilizes the Bollinger band channel and only considers entering when the price touches the lower band, thus avoiding frequent entries and exits amid market fluctuations.
Strategy Logic
The core logic relies on moving averages to determine the trend direction, and Bollinger bands to locate the fluctuation range for buying signals. Specifically, it has the following key rules:
-
Construct the golden cross system using 50-day EMA and 200-day EMA. An up trend is identified when the fast EMA crosses above the slow EMA.
-
When the price is above VWAP, it indicates the price is in an upward phase which favors long positions.
-
When the price just touches or breaks the Bollinger lower band, it suggests the price may be near a rebound point thus providing a good opportunity.
-
Exit long positions with profit when the price exceeds the Bollinger upper band.
By combining these rules, the strategy is able to locate appropriate long entries in bull markets and set stop loss/profit taking to secure returns.
Advantages
-
The golden cross system determines the major trend direction, avoiding small wins and losses amid consolidations.
-
VWAP gauges the price wave direction for more precise buying signals.
-
The Bollinger bands add resilience by locating buys while setting stop loss/profit taking locks in gains.
-
Multiple confirming indicators enhance reliability.
Risks and Solutions
-
The golden cross may give false signals. Fine tune the MA periods and add other confirmations.
-
Improper Bollinger parameters could render the strategy ineffective. Optimize periods and standard deviation.
-
A stop loss threshold too wide fails to effectively limit losses. Tighten the stop loss range to ensure controllable risks.
Optimization Directions
-
Optimize MA combinations by testing different parameters to find the best.
-
Test Bollinger periods and parameter sets for better bandwidth and volatility.
-
Test and tune stop loss ranges for balancing risk control and avoiding premature triggering.
Conclusion
This strategy strikes a balance between discovering opportunities and controlling risks by integrating MA, Bollinger and VWAP analysis for entries. Continuous fine tuning and optimization will allow it to capitalize on sector and market trends over time.
- 1