Multi-timeframe RSI+CCI+Bollinger Band DCA Strategy

1
Follow
1779
Followers
Overview
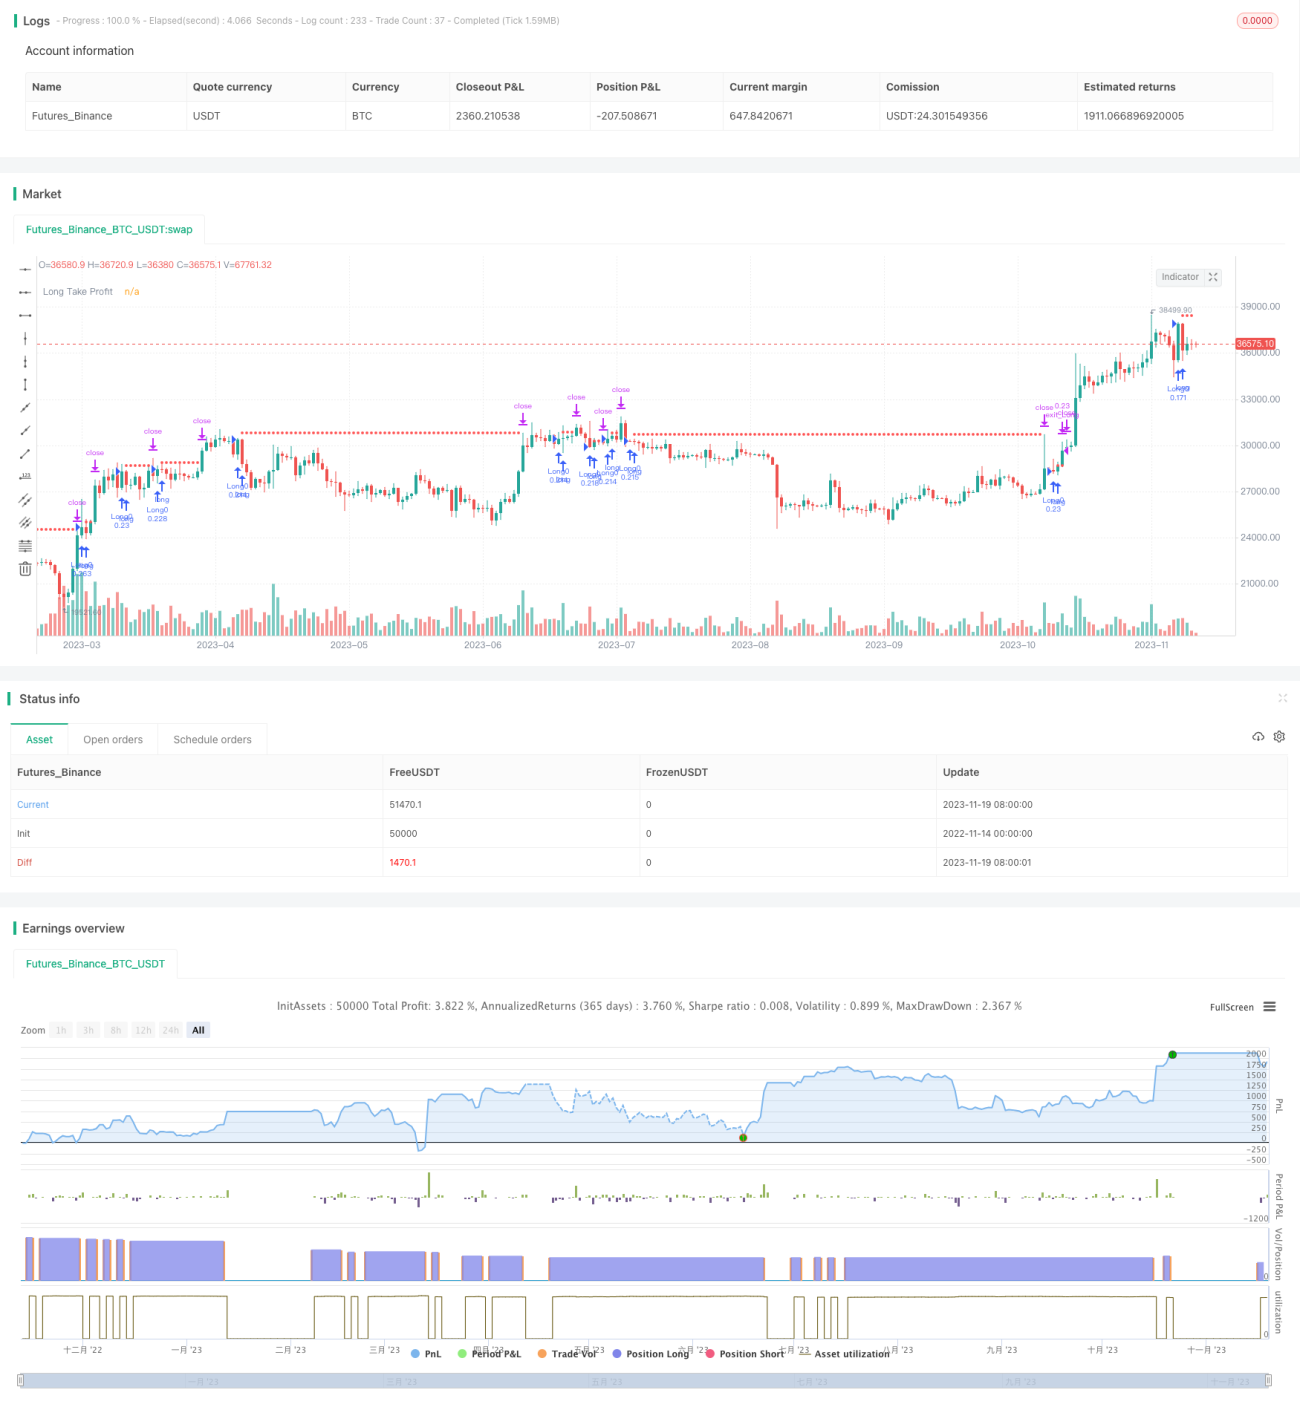
This strategy is a trend following strategy that determines trend direction through RSI, CCI and Bollinger Band indicators across different timeframes and gets in the market gradually via DCA to follow the trend for profits.
Strategy Logic
- Calculate RSI and CCI indicators on the 5min, 15min and 30min timeframes.
- When shorter-period RSI drops below a threshold and longer-period RSI also drops below a threshold, it is considered overbought. When shorter RSI rises above a threshold and longer RSI also rises above a threshold, it is considered oversold. CCI indicator logic is similar to RSI.
- Bollinger Bands judge if price has deviated too far from middle band. It serves as an auxiliary indicator.
- Gradually long on oversold and gradually short on overbought to achieve DCA effect.
Advantage Analysis
- Indicator combination across timeframes improves accuracy
- DCA strategy reduces average entry price
- Customizable position sizing controls risk
Risk Analysis
- Risk of missing best entry point
- Trend reversal risk
- Excessive trading risk from poor parameters
Solutions:
- Optimize parameters to ensure alignment
- Incorporate more indicators to determine trend
- Adjust per order position sizing
Optimization Directions
- Test combination of more indicators to find best combination
- Optimize per order position sizing
- Add stop loss
Summary
This strategy determines trend direction through multi-timeframe RSI and CCI, gets in the market via staged orders on overbought/oversold. It works very well when strong trend emerges. But inappropriate parameters can also lead to overtrading. Generally speaking, this strategy has large room for parameter tuning and stop loss optimization and can produce good results after optimization.
Source
Pine
Strategy parameters
Related strategies
Comment
All comments (0)
No data
- 1