Bollinger Break Out Strategy with Pyramiding

Overview
This strategy enters long or short positions based on breakouts of Bollinger Bands. It goes long when price breaks below lower band and goes short when price breaks above upper band. After entering positions, it continues pyramiding and updates stop loss in real-time.
Strategy Logic
The strategy uses 3 lines of Bollinger Bands - middle, upper and lower. The middle line is n-day moving average. The upper line is middle line + k * n-day standard deviation. The lower line is middle line - k * n-day standard deviation. Usually n is 20 and k is 2.
When price breaks out above upper line, it signals an downward trend and goes short. When price breaks out below lower line, it signals an upward trend and goes long.
After taking positions, the strategy keeps pyramiding, which means adding more positions in the same direction. The pyramiding entry rule is when price touches the middle line again after initial entry.
The stop loss for all positions are also updated in real-time based on the difference between current average holding price and the band price.
Advantage Analysis
The advantages of this strategy includes:
- Use Bollinger Bands to identify breakouts and trend changes accurately.
- Enter positions on golden cross and dead cross systematically.
- Earn more profit through pyramiding.
- Real-time stop loss updating to avoid being knocked out.
Risk Analysis
There are also some risks of this strategy:
- Bollinger Bands are sensitive to market volatility and may incur whipsaws.
- Pyramiding increases exposure and leverages potential loss.
- Stop loss is not guaranteed and still has the probability of being stopped out.
Some methods to tackle the risks:
- Optimize Bollinger Bands parameters for different cycles.
- Adjust pyramiding scale and frequency.
- Add middle line as further stop loss line.
Optimization Directions
The strategy can be optimized from below aspects:
- Optimize parameters of Bollinger Bands to adapt more market regimes.
- Improve pyramiding logic to balance risk-reward.
- Add more stop loss lines like middle line.
- Develop profit taking mechanism to lock profit proactively.
- Combine other indicators to filter entries.
- Enhance risk management to control loss per trade.
Conclusion
In conclusion, this is a typical trend following strategy. It rides the momentum when trend emerges and makes profit accordingly. Meanwhile, it also contains inherent risks. Further optimizations are needed to adapt more market conditions and tackle the whipsaw risk.
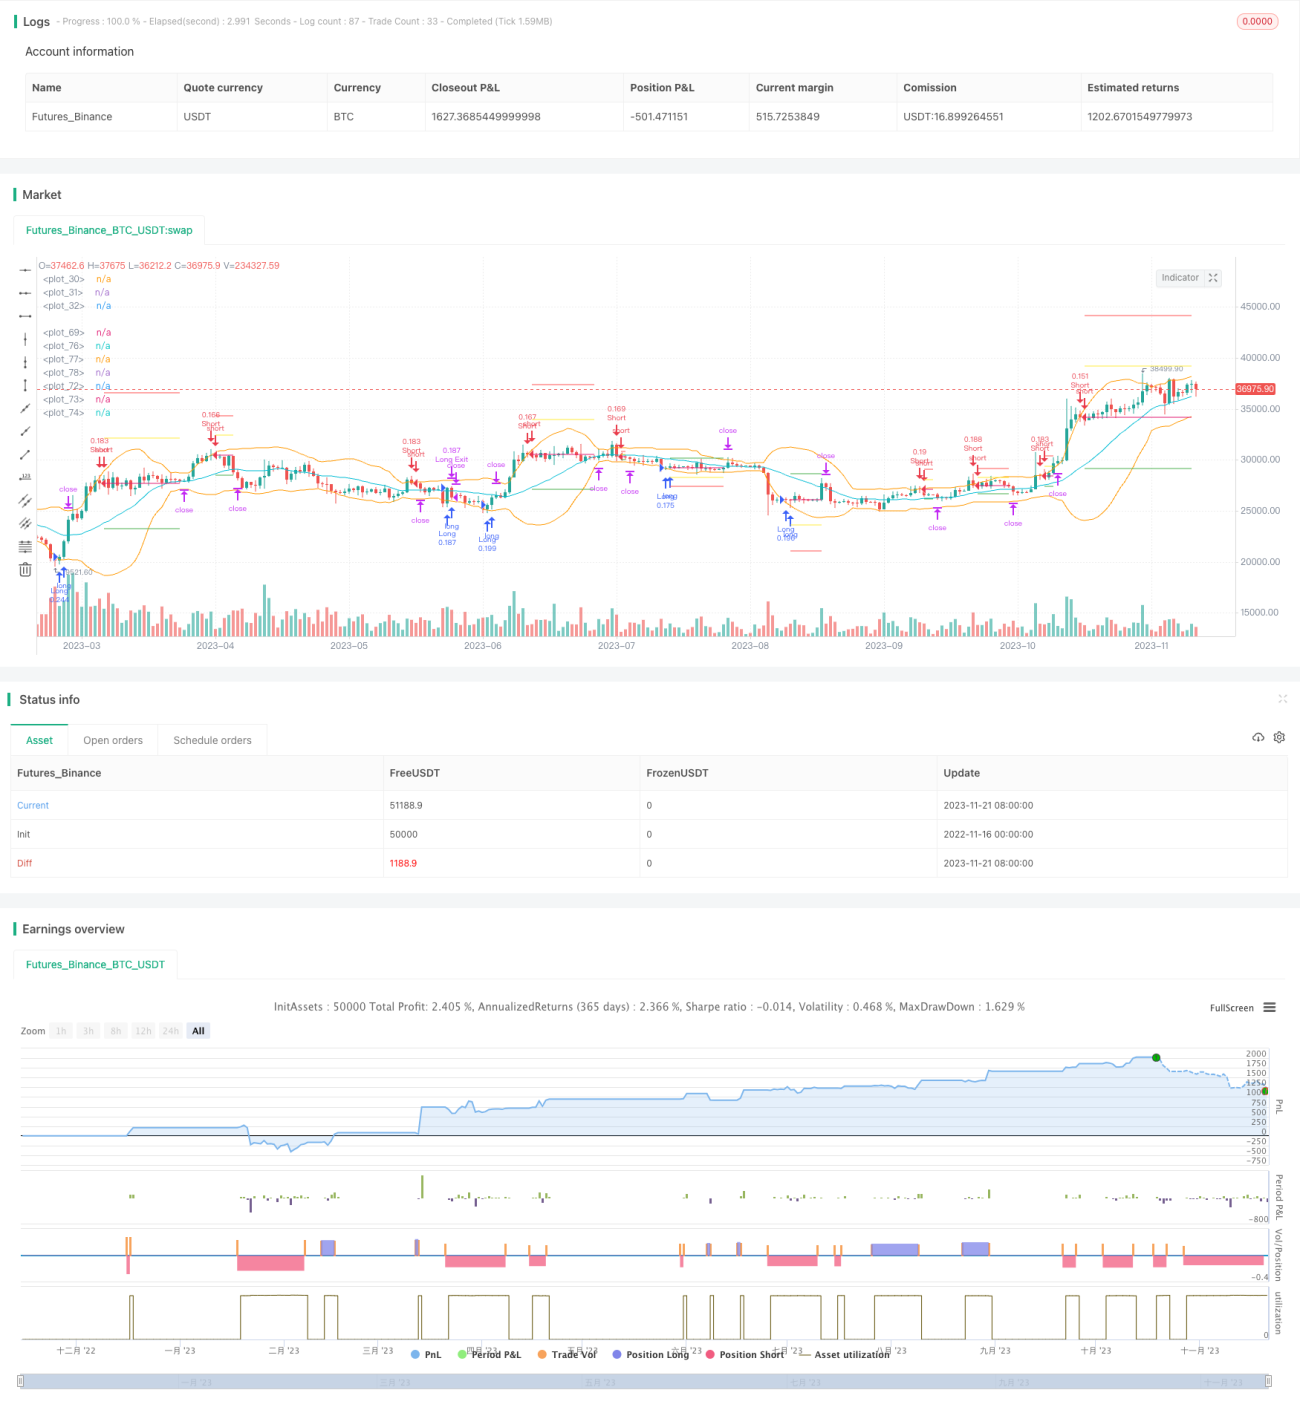
/*backtest
start: 2022-11-16 00:00:00
end: 2023-11-22 00:00:00
period: 1d
basePeriod: 1h
exchanges: [{"eid":"Futures_Binance","currency":"BTC_USDT"}]
*/

//@version=5

strategy(title='Bollinger Band strategy with split, limit, stop', shorttitle='bb strategy', overlay=true,commission_type = strategy.commission.percent, commission_value = 0.01, default_qty_type = strategy.percent_of_equity, default_qty_value = 10, pyramiding = 4)
- 1