Trend Tracking Strategy Based on Multi-indicator

Overview
This strategy identifies trends by combining multiple indicators such as RSI, MA, EMA and Bollinger Bands to implement trend tracking. When a relatively ascending downtrend is identified, the strategy will establish a long position. On the contrary, when a relatively descending uptrend is identified, the strategy will establish a short position.
Principle
The core logic of this strategy is to identify price trends by combining RSI, MA, EMA and Bollinger Bands. Specifically, it simultaneously plots two MA lines, one set to 10 periods and the other set to 5 periods. At the same time, two EMA lines are drawn with parameters of 30 and 20 respectively. The RSI indicator parameter is set to 7.
When the closing price breaks below the 5-period MA line, 20-period EMA line and lower rail, while the RSI indicator breaks below the 25 overbought line, the strategy judges that prices are relatively ascending and will enter a long position.
On the contrary, when the closing price breaks above the 10-period MA line, 30-period EMA line and upper rail, while the RSI indicator breaks above the 75 oversold line, the strategy judges that prices are relatively descending and will enter a short position.
As you can see, this strategy identifies potential trends by combining the logic of price breaking the moving average and RSI indicator reversal, and then tracks that trend.
Advantage Analysis
The biggest advantage of this strategy is that it uses multiple indicators to identify trends, which can effectively reduce false signals. Specifically, the price must break through the moving average and Bollinger Bands simultaneously to trigger trading signals, and the RSI indicator must also undergo a Langarde turnaround, which filters out a lot of noise.
In addition, the strategy tracks relatively clear trends rather than short-term noise, which also increases the probability of profit. In general, this strategy has advantages such as flexible configuration, difficulty being arbitraged, and high probability of profit.
Risk Analysis
It should be noted that no strategy can be 100% profitable, and this strategy is no exception. The main risk is that the combination judgment of multiple indicators goes wrong, resulting in wrong trades. In addition, sudden events can also invalidate the strategy.
To reduce risks, indicators parameters can be adjusted appropriately to optimize profitability. In addition, setting stop loss points to control single loss is also very necessary. Of course, unavoidable systemic risks require psychological preparation from investors.
Optimization
The main optimizations for this strategy are:
-
Test combinations of more types of indicators to find better multi-indicator combinations;
-
Optimize indicator parameters to improve strategy stability;
-
Increase machine learning models to assist judgment and improve accuracy;
-
Increase adaptive stop-loss mechanisms to control risks;
-
Backtest optimization to improve stability and profitability.
Conclusion
This strategy designed a set of relatively ascending tracking mechanism based on RSI, MA, EMA and Bollinger Bands, and enters directional positionss after judging price trends by combining multiple indicators. The integration of multiple indicators to judge can effectively reduce misjudgment probability and filter noise to a certain extent, tracking relatively clear trends. Of course, risk management also needs attention. Overall, this strategy has great optimization space, and can achieve better results with machine learning and other means.
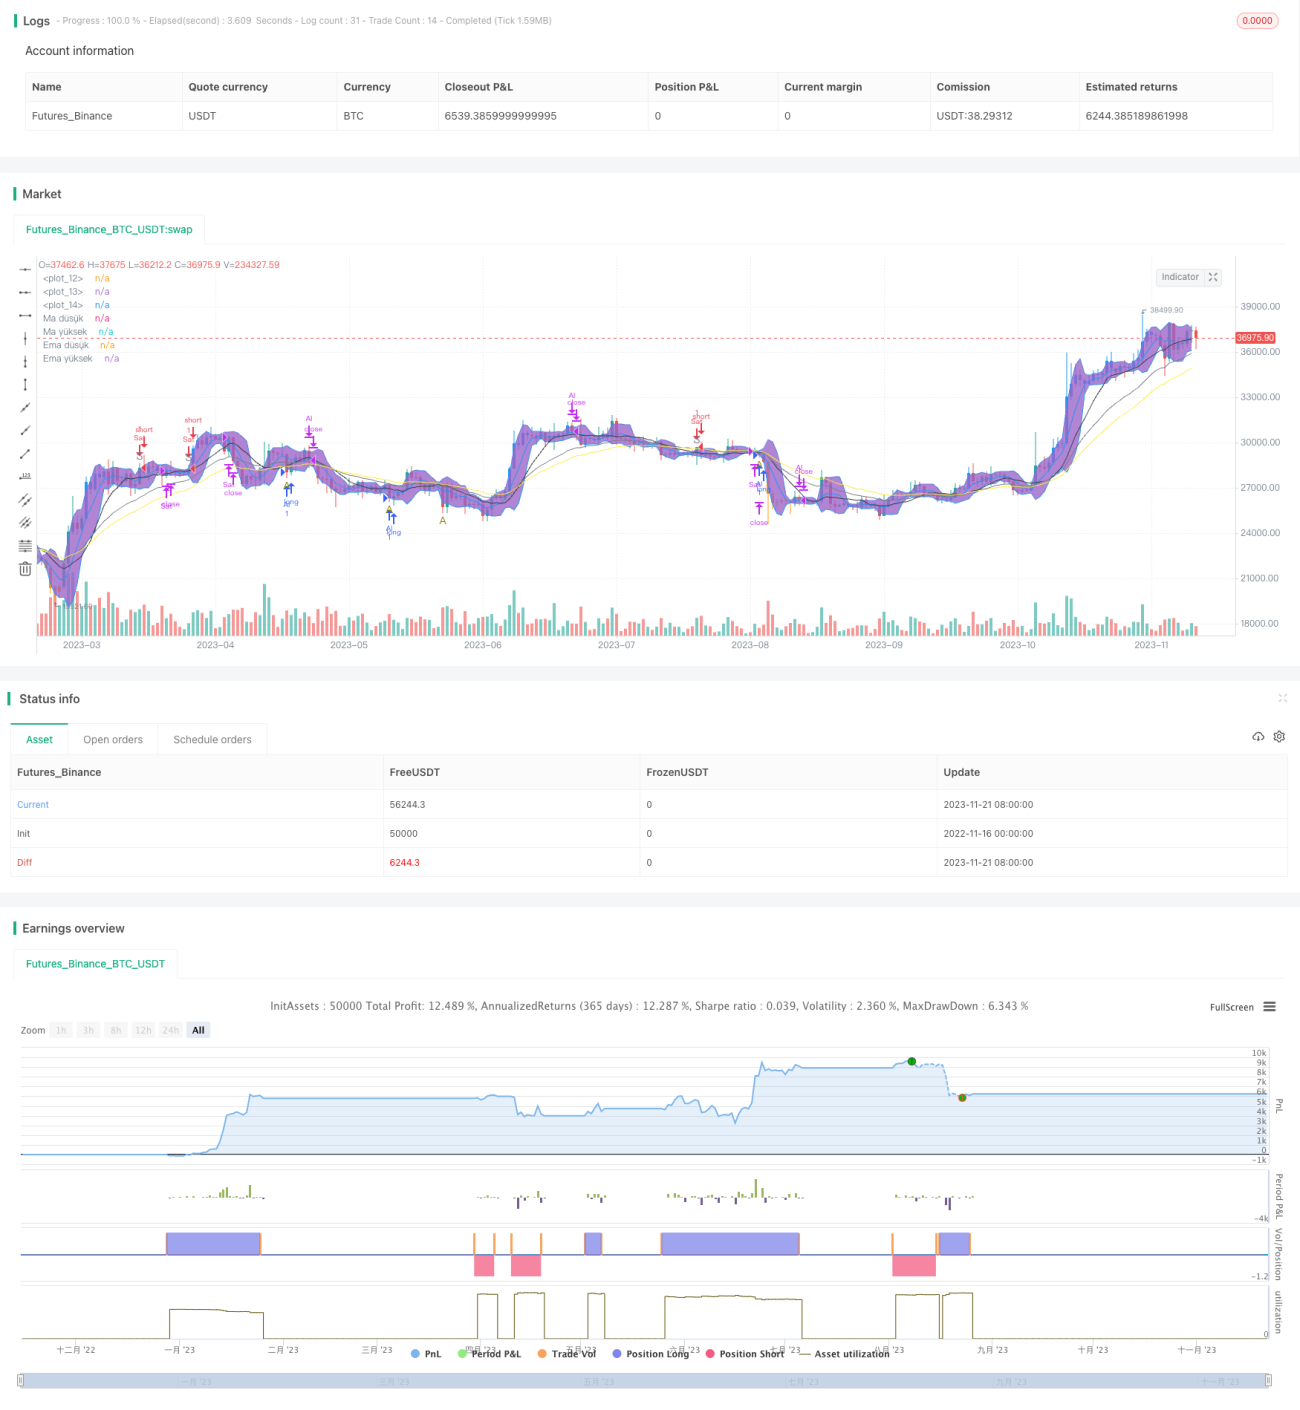
/*backtest
start: 2022-11-16 00:00:00
end: 2023-11-22 00:00:00
period: 1d
basePeriod: 1h
exchanges: [{"eid":"Futures_Binance","currency":"BTC_USDT"}]
*/

// This source code is subject to the terms of the Mozilla Public License 2.0 at https://mozilla.org/MPL/2.0/
// © lepstick-TC
//@version=4
strategy("1", overlay=true)- 1