Cross Timeframe SuperTrend Breakout Strategy

Overview
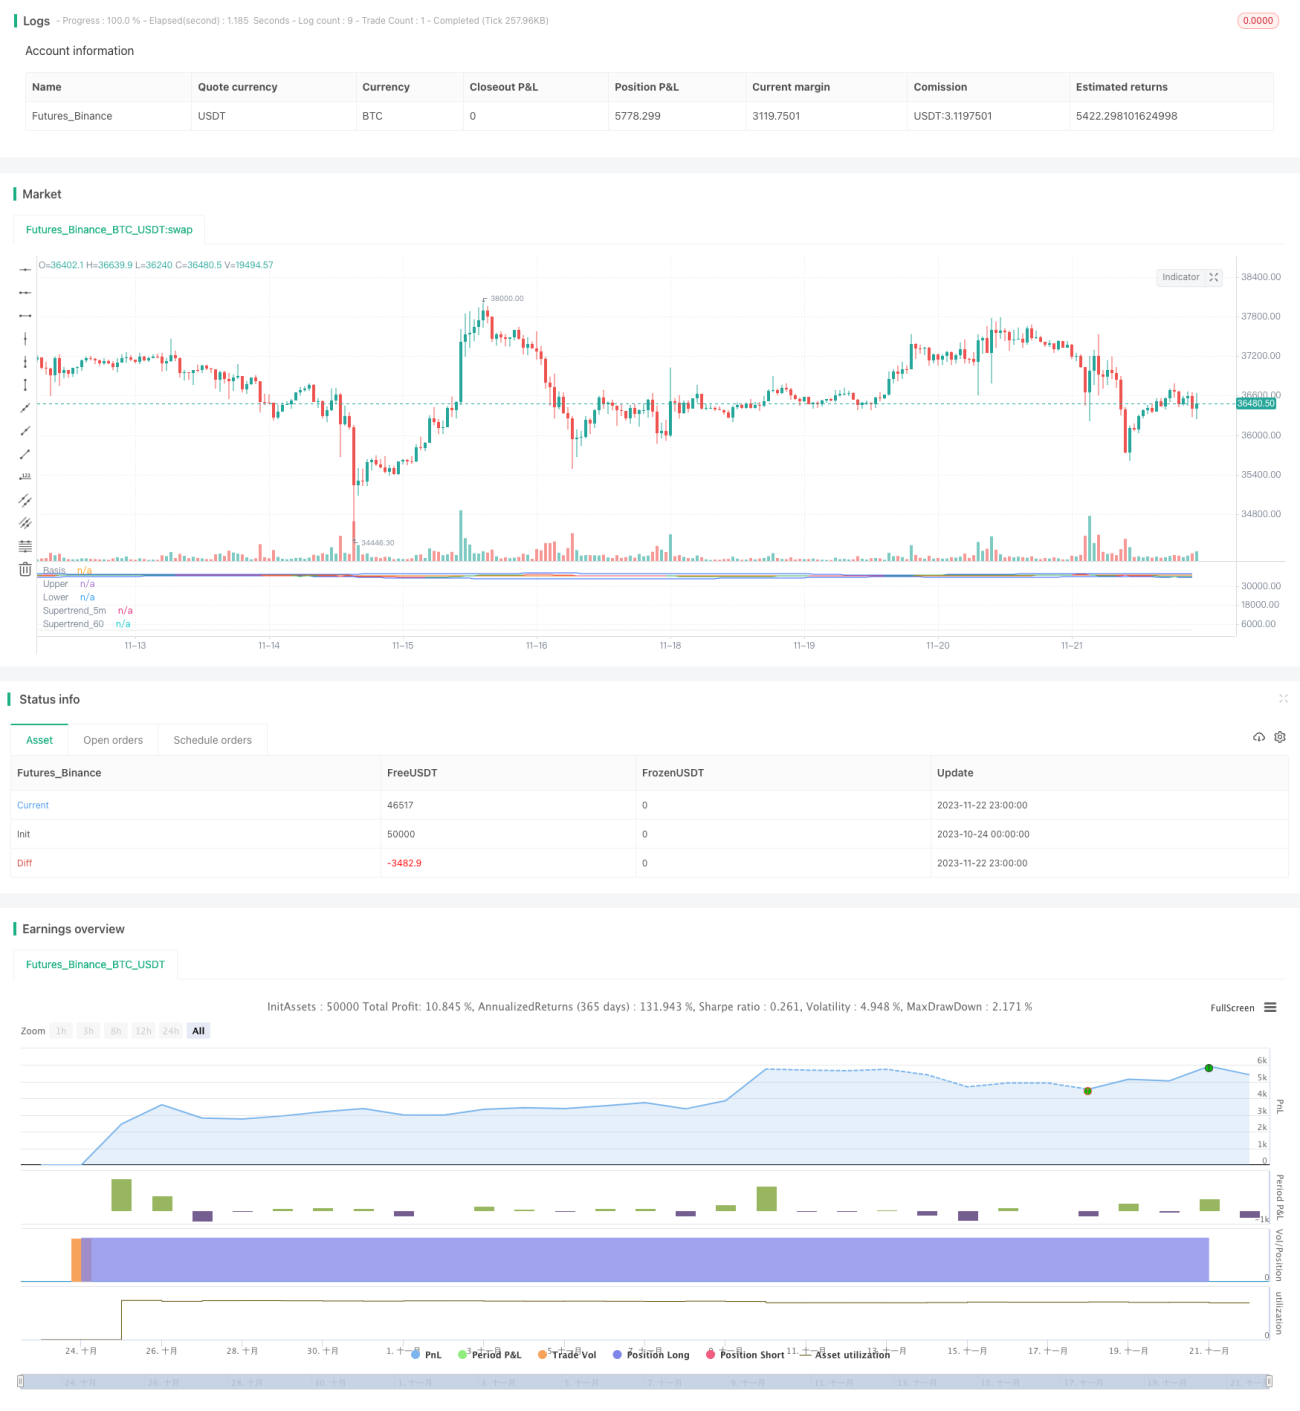
The strategy incorporates the SuperTrend indicator across multiple timeframes and Bollinger Bands to identify trend direction and key support/resistance levels, and enters trades on breakouts during volatility. It is designed mainly for highly volatile commodity futures like gold, silver, crude oil etc.
Strategy Logic
Custom Pine Script function pine_supertrend() implemented to compute SuperTrend across different timeframes (e.g. 1 min and 5 min) and determine the direction of larger timeframe trend.
Bollinger Bands upper/lower bands act as channels. Breakouts signals trend directionality. Close above upper band signifies bullish breakout. Close below lower band signifies bearish breakdown.
Entry Signals:
Long: Close > Upper Band AND Close > SuperTrend (multiple TF)
Short: Close < Lower Band AND Close < SuperTrend (multiple TF)
Exits:
Long Exit: Close < 5m SuperTrend
Short Exit: Close > 5m SuperTrend
So it aims to capture resonance breakouts between SuperTrend and BB in volatile momentum.
Advantage Analysis
- Uses SuperTrend across timeframes to determine high-conviction trend directionality
- BB Bands act as key support/resistance levels to avoid false breakouts
- SuperTrend acts as dynamic stop loss to control risk
Risk Analysis
- SuperTrend can lag turning points and trend reversals
- Suboptimal BB parameters may cause too many or few trades
- Sharp overnight gaps or news events can hit stop loss
Risk Mitigations:
- Add more indicators to confirm signals and avoid false breakouts
- Optimize BB parameters for best balance
- Widen stop loss buffer to accommodate gaps
Enhancement Opportunities
- Test other trend indicators like KDJ MACD for additional signal confirmation
- Add ML model for breakout probability
- Parameter tuning for optimal parameter set
Conclusion
The strategy combines the power of SuperTrend and Bollinger Bands using cross timeframe analysis and channel breakouts for high-probability trading. It effectively controls risk and can generate good profits in volatile instruments. Further optimizations and indicator combinations can improve performance.
- 1