Multi-indicator Trend Following Strategy

Overview
This strategy combines 3 open-source indicators to determine the trend across multiple timeframes, and sets stop loss and take profit points to lock in profits. Specifically, the AK MACD BB indicator is used to determine the short-term trend direction, the SSL indicator filters out some false signals, and finally the VSF indicator judges the actual buying/selling power to determine entry signals. At the same time, the strategy has pre-set stop loss and take profit points to lock in profits and significantly reduce the maximum loss per trade.
Strategy Principle
-
AK MACD BB Indicator
This indicator applies Bollinger Bands to the MACD indicator. When the MACD indicator line breaks through the upper band of the Bollinger Bands, a buy signal is generated. When it breaks through the lower band, a sell signal is generated.
-
SSL Indicator
The SSL indicator determines if the price has broken through the moving average, and detects pullback signals. When the price crosses above the moving average and the SSL indicator turns blue, it indicates an upward trend. When the price crosses below the moving average and the SSL indicator turns red, it indicates a downward trend, sending out trading signals.
-
VSF Indicator
The VSF indicator determines the strength of buyers and sellers. The strategy only issues signals when the strength of buyers or sellers is greater than 50% to avoid invalid breakouts.
-
Stop Loss and Take Profit
The strategy contains 4 levels of progressive take profit, ranging from 1.5 times to 3 times profit. At the same time, it sets a fixed 2% stop loss to effectively control the maximum loss per trade.
Advantage Analysis
-
Accuracy with multiple indicator combination
Determining trends across multiple timeframes using different indicators can filter out false signals and make judgments more accurate.
-
Automatically manage risks
The built-in stop loss and take profit settings in the strategy can keep the loss per trade controlled within about 2%, avoiding huge losses.
-
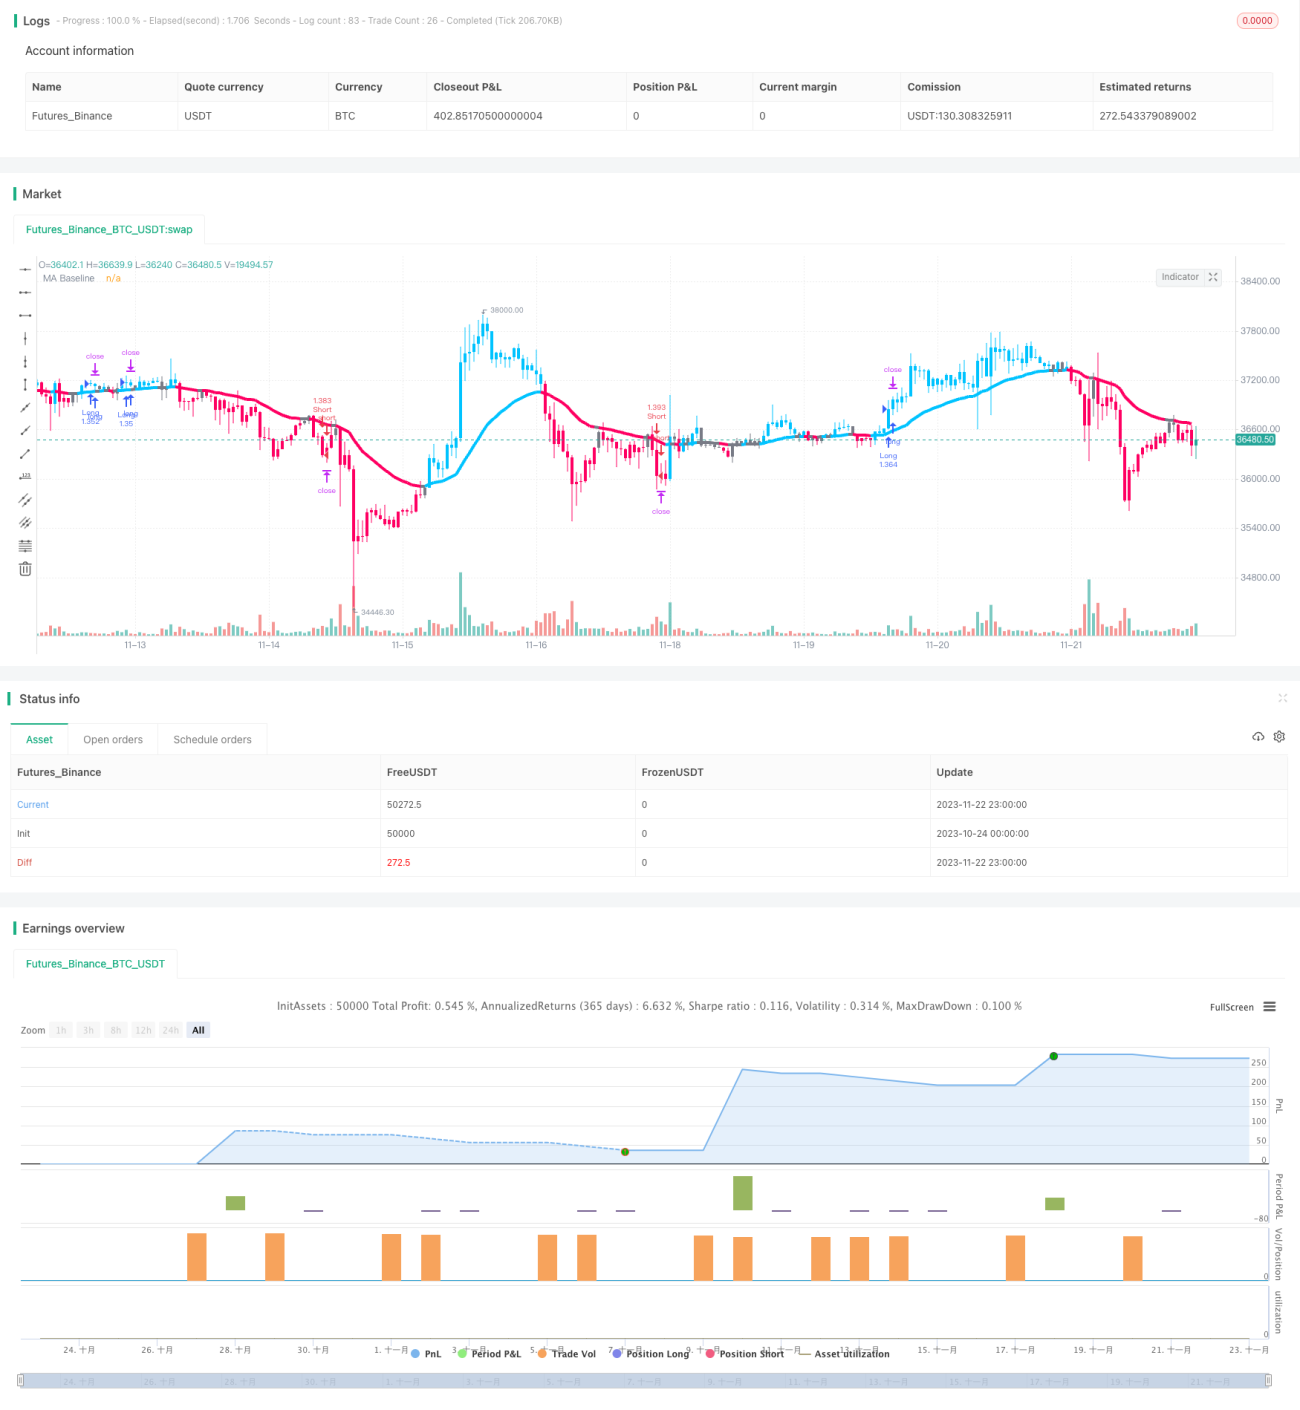
Excellent backtest data
According to the publisher, out of 100 trades, the profitable trade rate reached 74%, with a total profit of 427%.
Risks and Countermeasures
-
Market volatility risks
During violent fluctuations across larger timeframes, there may be multiple small losses. At this point the fixed stop loss level can be adjusted or trading stopped temporarily.
-
Limitation on long and short
The current strategy allows both long and short positions. If limited to only long or only short, profitable opportunities will be reduced by half.
-
Trading session risks
The strategy uses 5-minute data for judgment. If there are only a few hours of data available in a trading day, the sample size would be insufficient and signals may become unreliable.
Optimization Directions
-
Optimize stop loss and take profit
Different stop loss and take profit levels can be tested to find the optimal parameters. A stop loss that is too small cannot effectively control risks, while a stop loss that is too large may miss greater profits.
-
Add automatic position adjustment
Trailing stop loss or moving stop loss can be set up to lock in profits. Or add to positions under certain criteria to gain more profits.
-
Combine with other indicators
Different combinations of indicators can be tested to determine which combinations work the best. More indicators can also be added for cross validation.
-
Parameter optimization
Different sets of parameters can be backtested to find optimization directions. For this strategy, changing parameters of the Bollinger Bands or moving averages may produce better results.
Summary
This strategy integrates multiple indicators to determine the trend direction, and sets automatic stop loss and take profit points, allowing profits to be made during strong trends while keeping the loss per trade very small. Judging from the backtest data published by the author, its profit rate and return are very ideal. With certain optimizations, there is potential to further improve the stability and profitability of the strategy.
// This source code is subject to the terms of the Mozilla Public License 2.0 at https://mozilla.org/MPL/2.0/
// © myn

//@version=5
strategy('Strategy Myth-Busting #7 - MACDBB+SSL+VSF - [MYN]', max_bars_back=5000, overlay=true, pyramiding=0, initial_capital=1000, currency='USD', default_qty_type=strategy.percent_of_equity, default_qty_value=1.0, commission_value=0.075, use_bar_magnifier = false)


/////////////////////////////////////
//* Put your strategy logic below *//

/////////////////////////////////////
//nwVqTuPe6yo- 1