Trend Following Strategy Based on Moving Averages

Overview
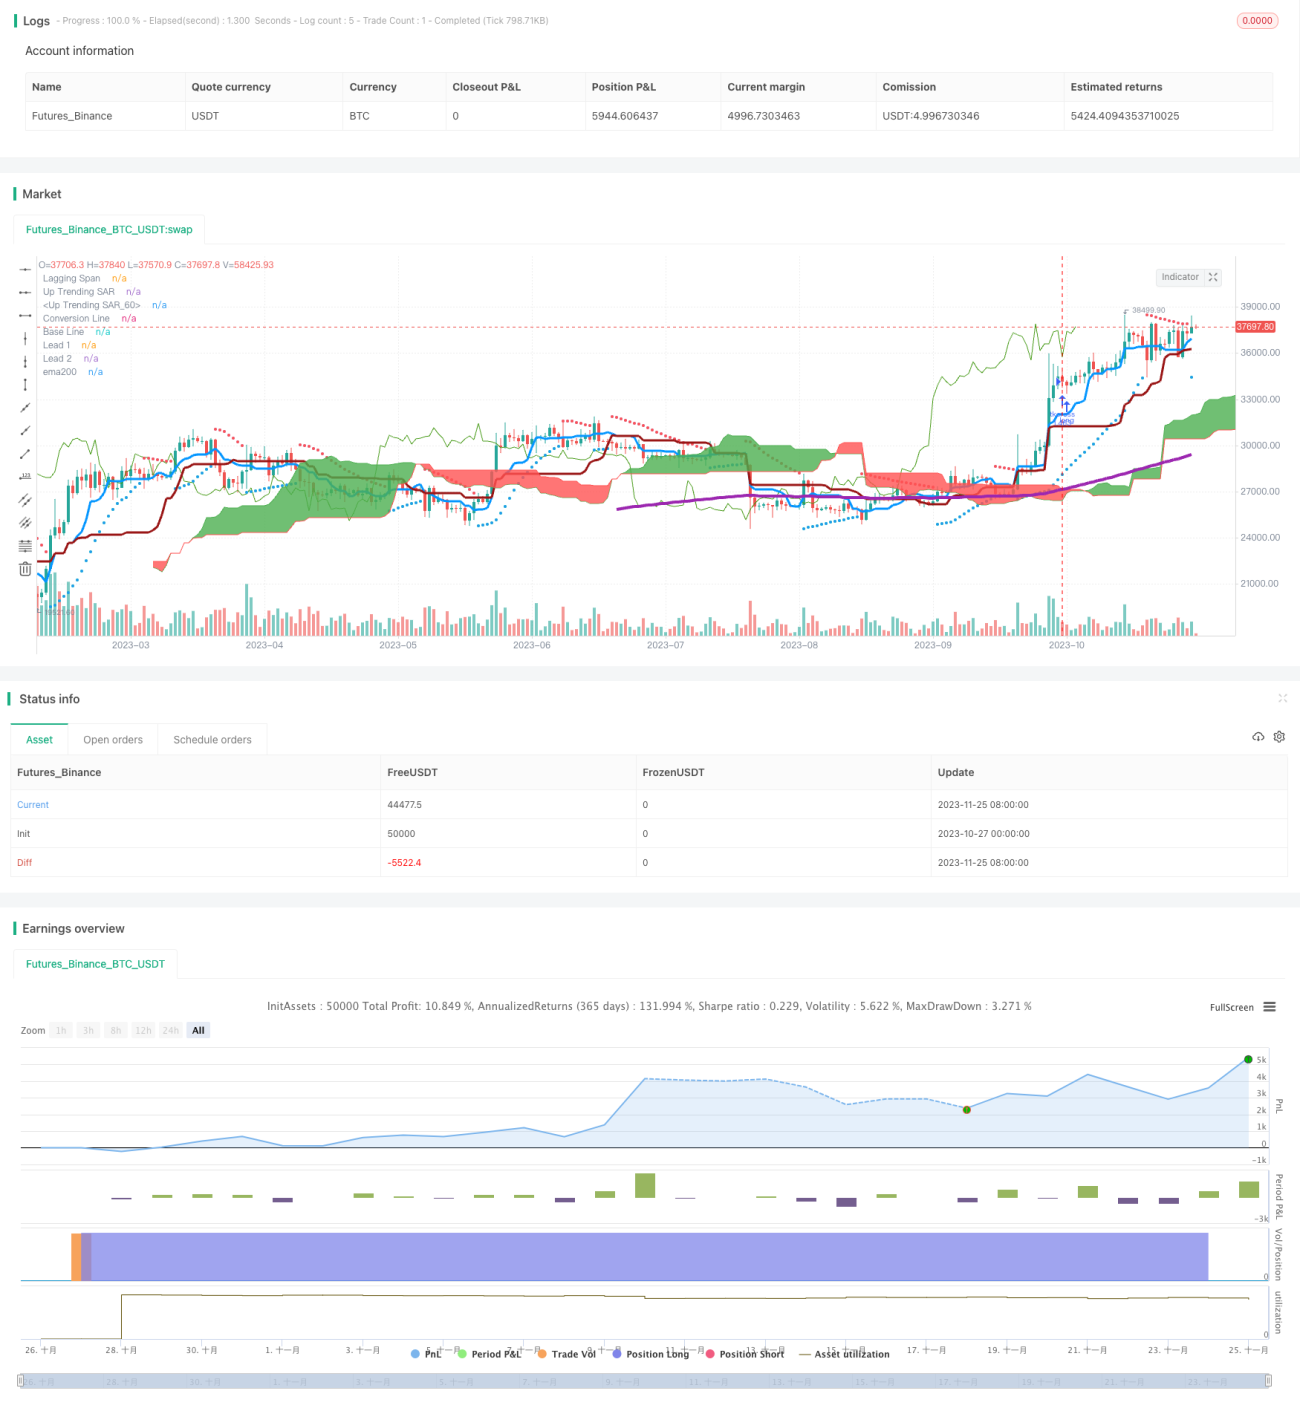
This is a trend following strategy based on moving averages. It utilizes the Ichimoku Cloud indicator to determine trend direction combined with the 200-day moving average to filter signals, thus tracking the trend.
Strategy Principle
The strategy mainly uses the conversion line and base line of Ichimoku Cloud to judge trend direction. The conversion line is the 9-day median price average and the base line is the 26-day median price average. A buy signal is generated when the conversion line crosses above the base line and a sell signal when crossing below.
The strategy also employs the 200-day moving average to filter signals. Only when the closing price is above the 200-day line will a buy signal be triggered. This filters out most of the false signals.
On the exit side, the strategy simply uses the conversion line crossing below the base line as the closing signal.
Advantage Analysis
The strategy combines the trend judgment indicator Ichimoku Cloud and long-term trend filtering indicator 200-day line, which can effectively track trends and filter out most false signals. Using median price averages reduces the impact of price anomalies on moving averages.
Compared to solely using moving averages, this strategy can better capture trend turning points and timely adjust positions. This is its greatest strength.
Risk Analysis
The strategy relies mainly on Ichimoku Cloud to determine trend direction, which itself could also generate false signals. If judgment is inaccurate, the strategy may lead to losses.
In addition, improper parameter settings could also lead to poor strategy performance. If the conversion line parameter is too short, false signals are easily formed; if the base line parameter is too long, the tracking effect deteriorates. Parameter tuning for balance is needed.
Optimization Directions
Consider incorporating other indicators to improve signal quality, such as the KDJ indicator to filter signals in overbought/oversold areas. Or use the ATR indicator to set stop loss.
On the parameter side, test more combinations, such as adjusting the conversion line parameter to 5 or 7 days for more sensitive trading signals. Also test modifying the base line parameter to around 20 days to balance tracking.
In addition, consider disabling the strategy under certain volatile environments to avoid the impact of wild swings.
Conclusion
The strategy integrates the advantages of trend judgment and long-term filtering indicators, which can effectively track medium and long-term trends. Meanwhile, parameter settings and risk control measures also need continuous optimization to reduce false signals and impacts from fluctuations. Overall, the strategy has decent performance and practical value for actual trading.
- 1