multiple auxiliary RSI indicator strategy

Overview
This strategy uses the RSI indicator to identify overbought and oversold conditions, and enters trades combining multiple auxiliary factors such as MACD, Stochastic indicators, etc. The goal of this strategy is to capture short-term reversal opportunities. It belongs to mean reversion strategies.
How it Works
The core logic of this strategy relies mainly on the RSI indicator to determine whether the market is in an overbought or oversold state. When the RSI indicator exceeds the set overbought threshold, it is a sign that the market may be overbought. The strategy will choose to short at this time. When the RSI falls below the oversold threshold, it indicates the market may be oversold. The strategy will go long in such cases. By capturing the short-term trading opportunities during the transition from one extreme condition to another, the strategy hopes to profit.
In addition, the strategy also incorporates multiple auxiliary factors such as MACD, Stochastic indicators. The role of these auxiliary factors is to filter out some potentially false positive trading signals. Only when the RSI indicator triggers a signal, and the auxiliary factors also endorse that signal, will the strategy take actual trading actions. Such collaborations between multiple factors can improve the reliability of the trading signals generated by the strategy, thus enhancing its stability.
Advantage Analysis
The biggest advantage of this strategy is its high capturing efficiency realized through a multi-factor confirmation mechanism to improve signal quality. Specifically, it is reflected in the following aspects:
- The RSI indicator itself has strong capabilities of identifying market regimes and overextended conditions.
- With the help of multiple auxiliary tools for multi-factor confirmation, the signal quality is improved and large amounts of false positives are filtered out.
- The strategy is not sensitive to parameters and is easy to optimize.
Risks and Solutions
There are still some risks associated with this strategy, which are mainly concentrated in two aspects:
- Failed reversal risk. Reversal signals themselves rely on statistical arbitrage opportunities, and there is still probability for individual failed reversals. We can control risks by reducing position sizes or setting stop losses.
- Loss risk in uptrends. The strategy is still mainly contrarian, inevitably leading to certain losses in upward trending markets. This requires us to accurately judge the major trend. If necessary, manual intervention can be introduced to skip unfavorable market environments.
Optimization Directions
The following aspects need to be optimized for this strategy going forward:
- Test on different products to find the optimal parameter combinations. Although not very sensitive, it is still advisable to search for the best parameters for different products.
- Introduce adaptive exit mechanisms. Approaches like dynamic stops, timed exits etc. can be tested to make the strategy more adaptive to evolving markets.
- Incorporate machine learning models. Models can be trained to estimate reversal success probabilities in order to improve the strategy's winning rate.
Conclusion
In conclusion, this is a short-term mean reversion strategy. By leveraging RSI’s capabilities of gauging overbought/oversold conditions, and combining multiple auxiliary tools for multi-factor confirmation, the signal quality is improved. The strategy has high capturing efficiency and good stability. It deserves further testing and optimization for eventual profitability.
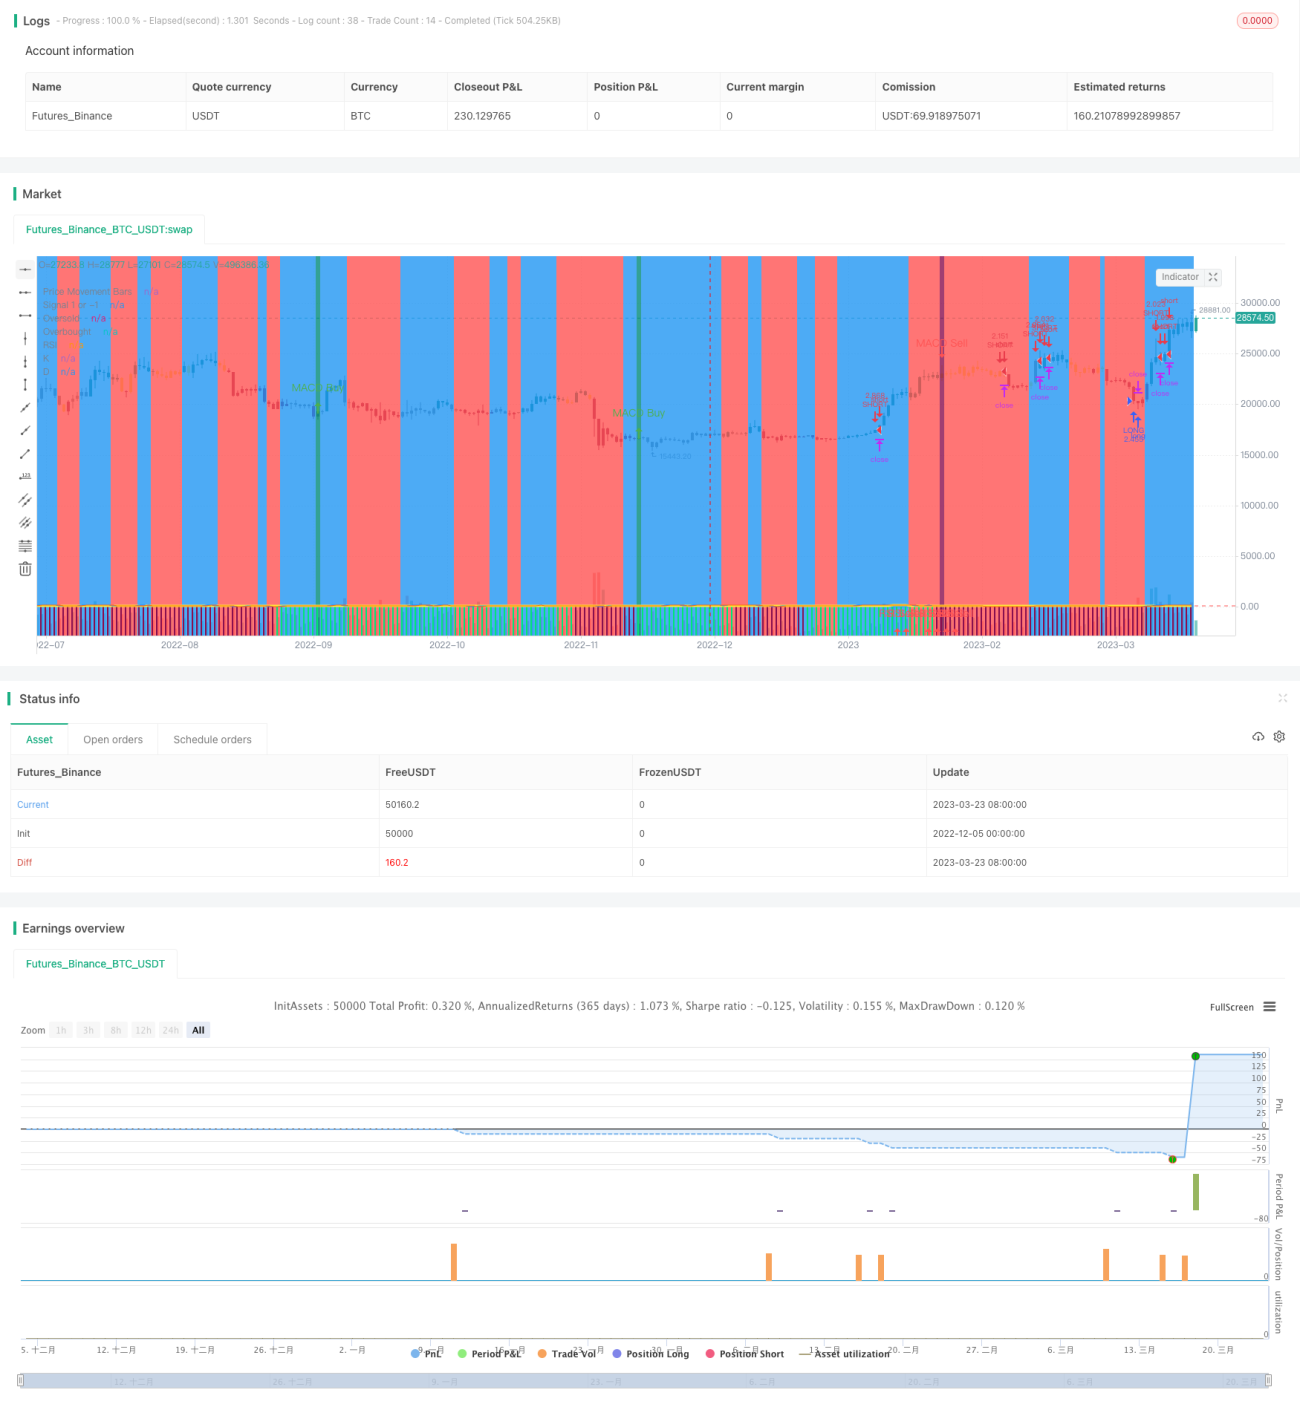
/*backtest
start: 2022-12-05 00:00:00
end: 2023-03-24 00:00:00
period: 1d
basePeriod: 1h
exchanges: [{"eid":"Futures_Binance","currency":"BTC_USDT"}]
*/

// This source code is subject to the terms of the Mozilla Public License 2.0 at https://mozilla.org/MPL/2.0/
//@version=4

strategy(shorttitle='Ain1',title='All in One Strategy', overlay=true, initial_capital = 1000, process_orders_on_close=true, default_qty_type = strategy.percent_of_equity, default_qty_value = 100, commission_type=strategy.commission.percent, commission_value=0.18, calc_on_every_tick=true)- 1