EMA and SuperTrend Combined Trend Following Strategy

Overview
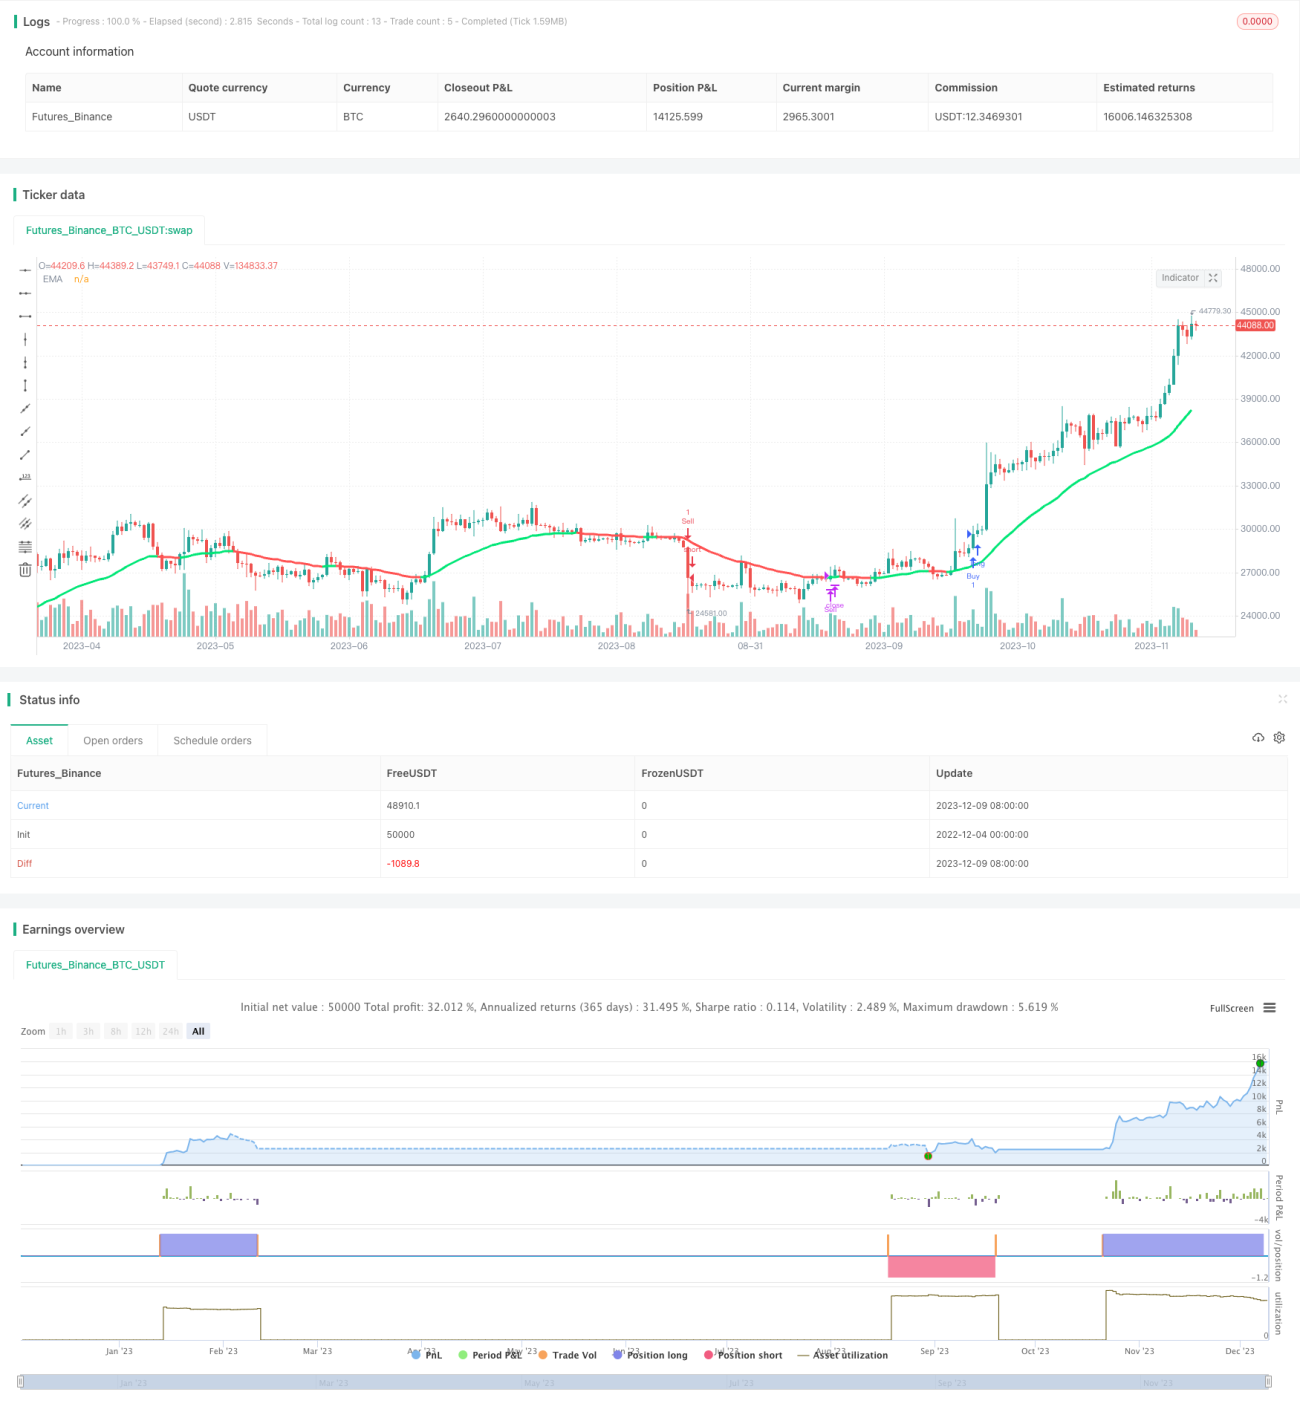
The EMA and SuperTrend Combined Trend Following Strategy ingeniously combines the EMA indicator and the SuperTrend indicator to identify market trends and provide clear entry and exit signals. The strategy allows customization of SuperTrend parameters as well as EMA parameters to suit different trading styles. The color-coded bars make trend identification intuitive. The strategy determines entry timing based on crossover signals between the EMA and SuperTrend indicators. Exit rules are flexible - you can either exit when the trend reverses or when the price recrosses the EMA, which helps with risk management.
Strategy Principle
The strategy uses the SuperTrend indicator to determine the main trend direction. Essentially, the SuperTrend indicator combines the ATR indicator with moving averages and utilizes price breaks of average lines to determine trend reversal points. On the other hand, the EMA indicator serves to assist in judging short-term trend direction. Long positions are only considered when prices are above the EMA, and short positions are only considered when prices are below the EMA.
Specifically, the strategy employs the following rules:
- Long signal: when price breaks above SuperTrend line and is higher than EMA;
- Short signal: when price breaks below SuperTrend line and is lower than EMA;
- Close long position: when price breaks below SuperTrend line or is lower than EMA;
- Close short position: when price breaks above SuperTrend line or is higher than EMA.
Advantage Analysis
Stable Trend Identification
The combination of EMA and SuperTrend allows for more reliable trend judgments compared to single indicators. The combination can more effectively filter out some false breakouts.
Flexible Parameter Adjustment
Allowing customization of SuperTrend and EMA parameters adapts the strategy to different products and time frames.
Clear Entry and Exit Signals
The long, short, and exit signals provided by the strategy are quite clear, aiding decision-making. The exit rules are also clear, facilitating risk control.
Intuitive Visual Expression
Based on the price’s position relative to the EMA, the bars are colored differently, forming an intuitive visual effect.
Risk Analysis
May Miss Some Opportunities
Compared to single indicators, this strategy has higher signal confirmation requirements, thus possibly missing opportunities with shallow pullbacks.
Risk of False Breakouts Still Exists
Although the strategy verifies the breakout signals, there is still the possibility of false breakouts causing strategy failure during drastic market fluctuations.
Effectiveness Related to Parameter Settings
The SuperTrend and EMA parameter settings can greatly impact strategy effectiveness. Improper parameter settings may lead to multiple exits followed by re-entries.
Optimization Directions
-
Add Other Indicators to Filter Signals
Consider combining indicators like MACD, Stochastics with EMA and SuperTrend to further verify signals and reduce false breakouts.
-
Multi-Timeframe Validation
Judge trend direction on higher timeframes (e.g. daily) to verify and filter signals generated on the current timeframe.
-
Automatic Parameter Optimization
Try traversing different parameter combinations and selecting optimal settings for given products and timeframes based on backtest metrics.
Conclusion
The EMA and SuperTrend Combined Trend Following Strategy successfully combines the strengths of trend determination and trend following. The strategy provides solid support for trading decisions through stable, clear signals and customizable parameters. Of course, we still need to watch out for potential false breakout risks. Further enhancements can be made through additional signal verification using other indicators or multi-timeframe analysis.
- 1