Momentum Oscillation Crossing Bollinger Bands with Moving Average Strategy

Overview
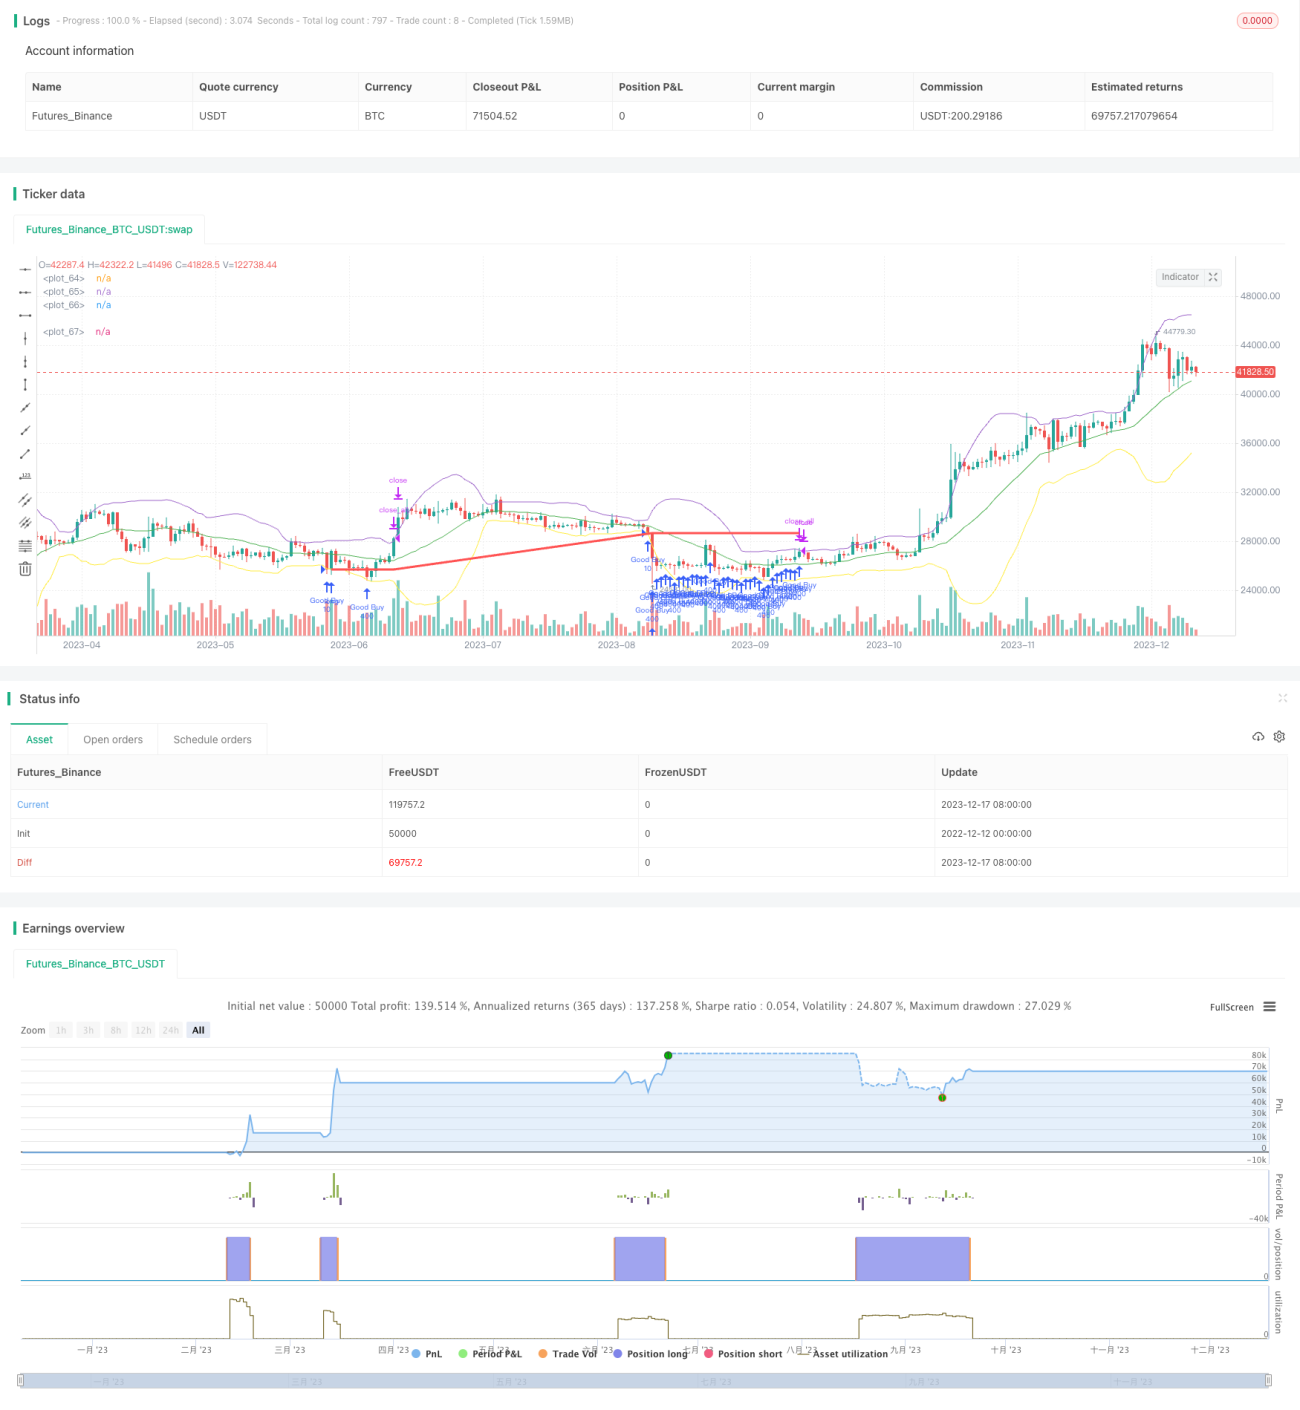
This is a quantitative trading strategy based on Bollinger Bands and MACD indicators. It combines two mainstream technical indicators to identify trading opportunities, aiming to achieve higher win rate in trending markets.
The strategy will establish long position when price breaks through the lower band of Bollinger Bands for trend following, and close position when price breaks through upper band. MACD indicator is used to filter false breakout by judging momentum direction. RSI indicator can be configured to assist in identifying overbought and oversold levels to further avoid losses.
Strategy Logic
The strategy consists mainly of Bollinger Bands and MACD indicators.
Bollinger Bands calculate upper and lower bands based on standard deviation of prices. Upward breakout of upper band signals overbought condition, while downward breakout of lower band signals oversold condition. This strategy goes long when price breaks down the lower band, and closes position when it breaks up the upper band.
MACD indicator judges momentum and direction of prices. Crossover of short term moving average above long term moving average is buy signal, while crossover below is sell signal. MACD helps filter false breakout of Bollinger Bands in this strategy.
Additionally, RSI indicator can assist in identifying overbought/oversold levels. Low RSI represents oversold and enhances buy signal, while high RSI represents overbought and enhances sell signal.
Advantages of the Strategy
The strategy combines Bollinger Bands, MACD and RSI indicators, which can effectively determine price trend and volatility. Its advantages include:
- Bollinger Bands capture trend following when price breaks out of bands
- MACD filters false signals from Bollinger Bands by judging momentum
- RSI avoids buying at peak by identifying overbought/oversold levels
- Higher win rate can be achieved through parameter optimization
Risks of the Strategy
There are also some risks to be aware of:
- High risk of stop loss when prices fluctuate violently
- Profitability decreases with improper parameter settings
- MACD may misjudge when trend reverses
Countermeasures:
- Stop loss percentage can be loosened appropriately
- Extensive backtesting required to find optimum parameters
- More indicators can be used to predict trend reversal
Directions for Optimization
Major directions to optimize the strategy include:
- Optimize parameters of Bollinger Bands for more market regimes
- Increase indicators to improve robustness
- Utilize machine learning to auto optimize parameters
- Test strategy performance on high frequency data
- Add risk management module to limit per trade loss
Conclusion
Overall this is a typical trend following strategy. By combining multiple technical indicators, it improves robustness and can achieve decent win rate when signals are accurate. However risks need to be monitored. Further improvements can be made through continuous optimization and tuning.
- 1