RSI Bollinger Bands TP/SL Strategy

I. Strategy Overview
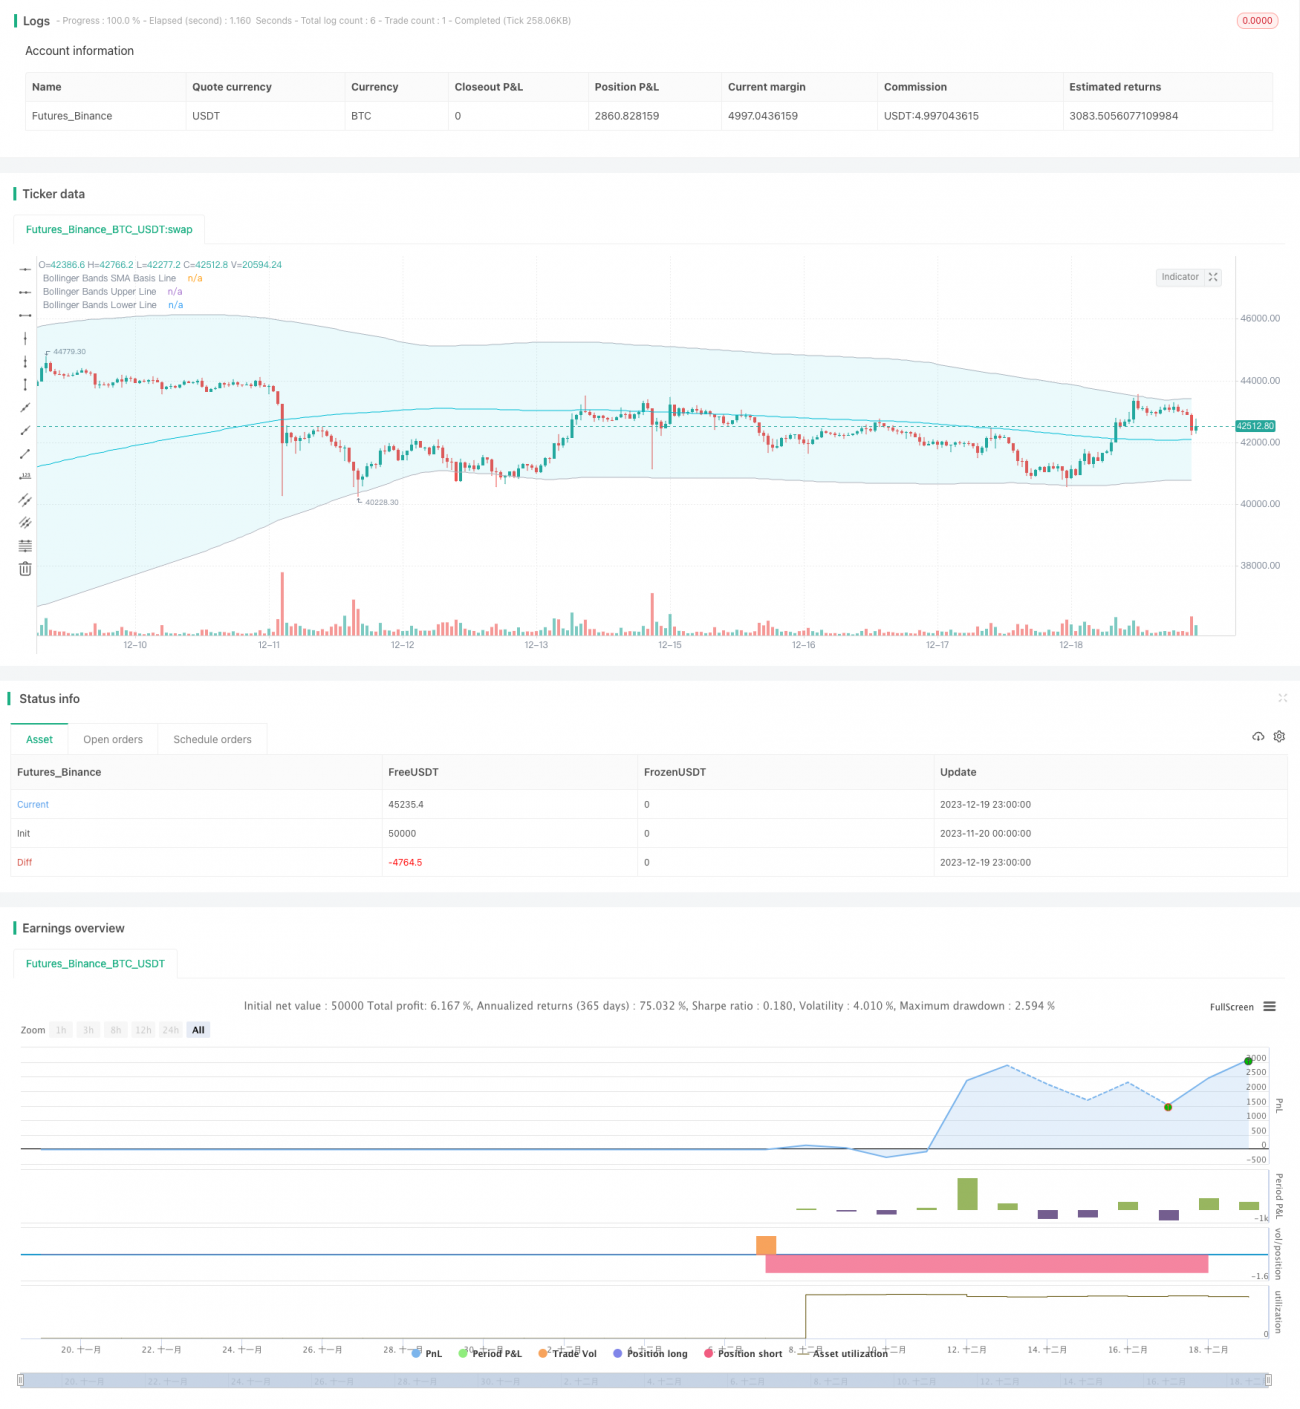
The strategy is named RSI Bollinger Bands TP/SL Strategy. It combines the RSI indicator and Bollinger Bands to identify trends and trading signals. When the RSI indicator shows overbought or oversold signals and the price touches or breaks through the Bollinger Bands, long or short positions will be opened. Besides, take profit and stop loss points are also set to control risks.
II. Strategy Logic
1. RSI Indicator for Reversals
The RSI indicator judges whether a stock is overbought or oversold. An RSI reading above the overbought line indicates overbought conditions, while a reading below the oversold line indicates oversold conditions. The overbought line is set at 50 and the oversold line is set at 50 in this strategy.
2. Bollinger Bands for Trend
Bollinger Bands plot standard deviation lines above and below a simple moving average. The upper band acts as resistance and the lower band acts as support. An up-crossing of the lower band is a buy signal, while a down-crossing of the upper band is a sell signal.
3. Combination of RSI and Bollinger Bands
When the RSI indicator shows a bottom reversal signal and the price breaks through the lower band of Bollinger Bands, it is regarded as an upward reversal, thus going long. When the RSI indicator shows a top reversal signal and the price breaks down the upper band, it is regarded as a downward reversal, thus going short.
III. Advantages
1. Improved Accuracy with Dual Indicators
The RSI and Bollinger Bands are both used to determine trends and reversals. The combination improves signal recognition accuracy and avoids false breakouts.
2. Risk Control using TP/SL
The strategy sets take profit (TP) and stop loss (SL) points to lock in profits and maximize loss mitigation.
3. Customizable Directions
Users can go long only, short only or both directions based on market conditions, allowing flexible risk control.
IV. Risks
1. Sensitive Bollinger Bands Parameters
The standard deviation size affects bands width and trading signals. Improper settings may generate excessive false signals.
2. Risks of TP/SL
V-shaped reversals can trigger unnecessary losses with TP/SL settings being too aggressive.
3. Sensitive RSI Parameters
Wrong RSI parameter settings lead to decreased accuracy of reversal signals.
V. Optimization Directions
1. Optimize RSI Parameters
More RSI length values can be tested to find the optimal parameter combination.
2. Optimize Bollinger Bands Parameters
More lengths and standard deviations can be tested to find the optimal parameter combination.
3. Test Different TP/SL Ratios
Backtesting can help find the optimal TP/SL ratio.
VI. Conclusion
This strategy leverages RSI and Bollinger Bands to identify trends and reversals, and sets TP/SL to control risks. It can automatically detect trading signals and manage exits. There are still some risks that can be improved by parameter optimization. In general, this is a practical strategy with strong applicability.
- 1