The RSI breakout strategy is a quantitative trading strategy

Overview
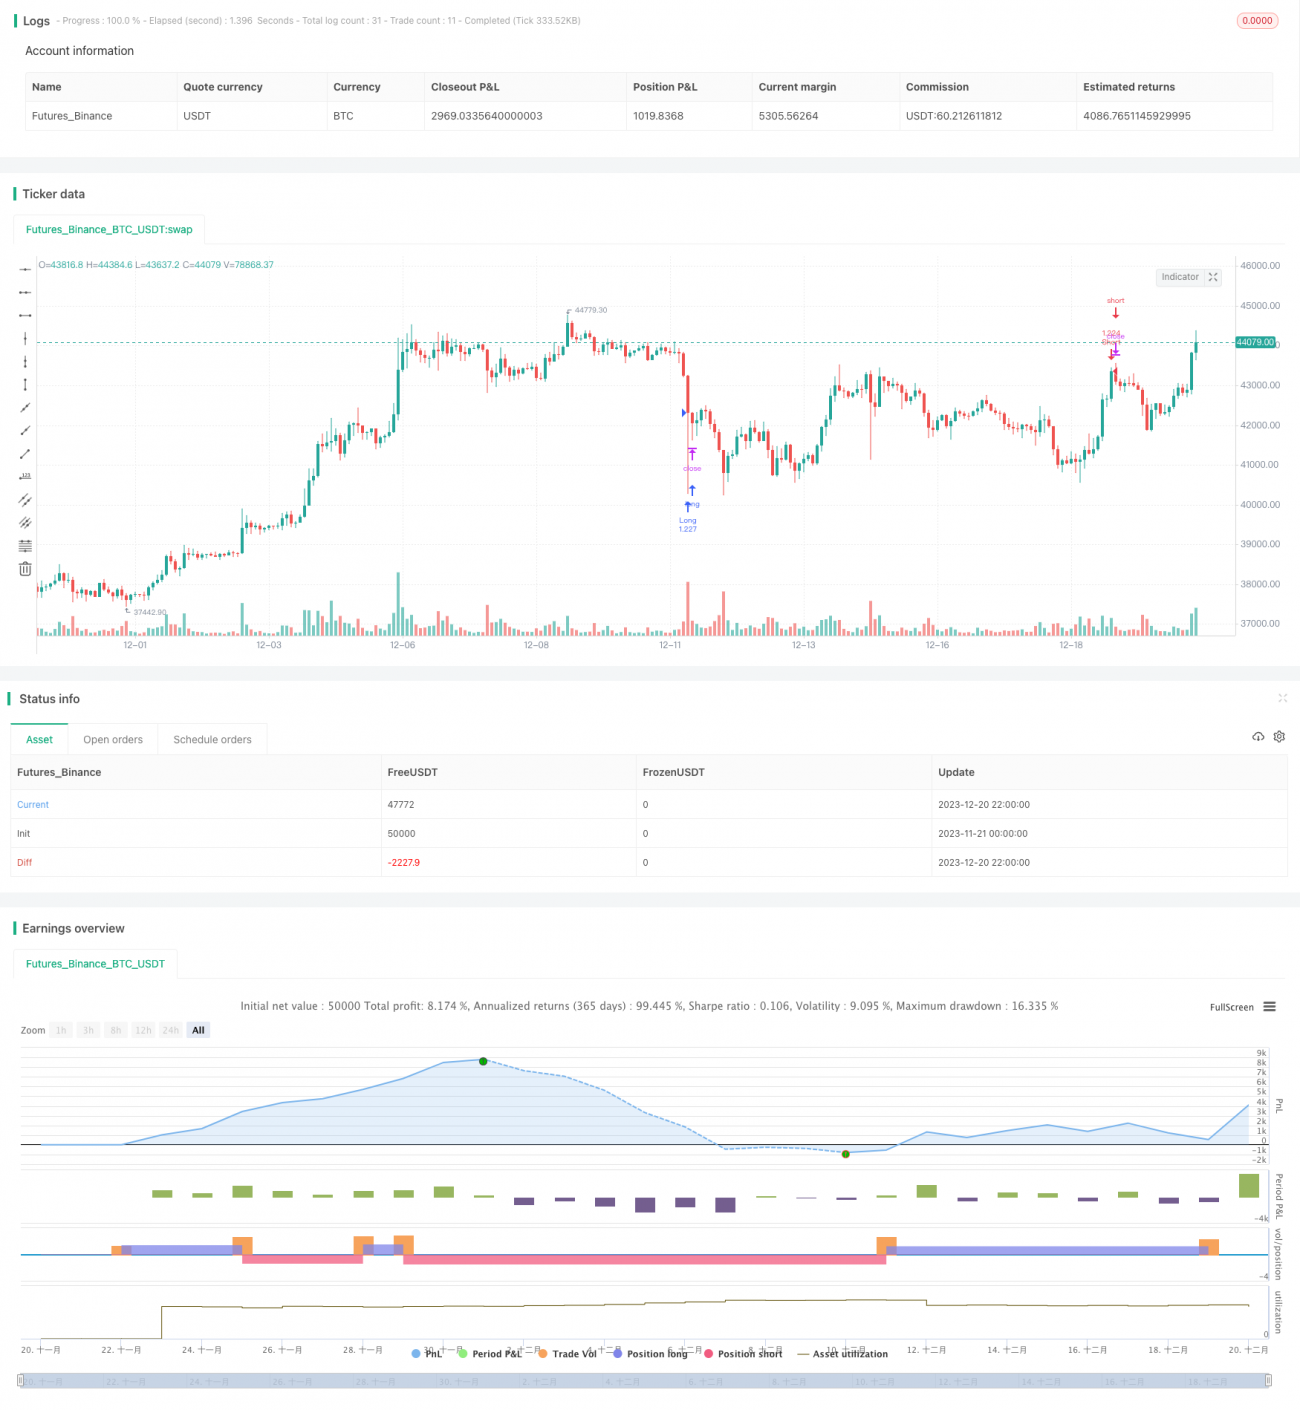
The RSI breakout strategy is a quantitative trading strategy based on the Relative Strength Index (RSI) indicator. The strategy generates trading signals when the RSI breaks through preset overbought and oversold threshold values, i.e. go long when RSI is below 30 and go short when RSI is above 70.
Strategy Logic
The core idea of the RSI breakout strategy is to utilize the RSI indicator to determine overbought and oversold conditions in the market. The RSI calculates the ratio of average price gains and losses over a period of time to reflect the recent strength or weakness of a stock. Generally, RSI below 30 is considered oversold and RSI above 70 overbought.
The strategy first sets the oversold and overbought threshold values for RSI, with default values of 30 and 70. It then monitors the RSI line in real time. When the RSI crosses below the 70 threshold from top to bottom, a sell signal is generated. This indicates the market has entered the overbought zone and is likely to reverse downwards, so a short position is taken. Conversely, when the RSI breaks above the 30 threshold, a buy signal is generated, indicating the oversold market is likely to bounce back up, so a long position is taken.
In this way, the strategy attempts to capture price reversal points during stock fluctuations and adjust positions accordingly to "buy low and sell high".
Advantages
The RSI breakout strategy has the following advantages:
-
Simple and clear trading signals. The RSI indicator is easy to calculate and interpret by merely observing if the indicator line breaks the threshold values. Trades can be taken promptly when signals occur without complex rules.
-
Fully automatable with good backtest results. Trades are generated by the RSI indicator without human interference. At the same time, RSI overbought and oversold signals tend to be effective, leading to decent strategy returns in backtests.
-
Highly customizable. Traders can flexibly tune RSI parameters like the overbought/oversold thresholds to suit different stock and market dynamics.
Risks
The RSI breakout strategy also carries some risks:
-
Prone to whipsaws. Frequent crossover of the indicator threshold values can lead to excessive ineffective trades, hampering steady profits. Parameters can be tuned to filter some whippy signals.
-
No trend judgment. RSI only produces signals based on overbought/oversold levels without judging the overall trend well. The strategy tends to get stuck in choppy markets. Trend filters can be added to avoid counter-trend trades.
-
High drawdown risks. RSI often exhibits bullish divergence where price continues up while RSI trends down. Short trades will face huge losses in such cases.
Enhancement Areas
The RSI breakout strategy can be enhanced in the following ways:
-
Incorporate multiple indicators to overcome RSI's limitations, e.g. moving averages to determine market trend, strength indicators and volume filters to confirm signals.
-
Optimize RSI parameters for higher stability, including tuning overbought/oversold thresholds, setting signal duration filter etc through rigorous testing. This filters ineffective signals.
-
Implement stop loss and take profit to control risks. For example, set percentage or point stops. Avoid oversized single-trade losses on overall profits. Also consider trend and technical points for profit taking.
Conclusion
The RSI breakout strategy is a mean reversion quantitative strategy based on overbought and oversold signals. It has simple and clear signals, full automation capabilities and high customizability but suffers whipsaw and drawdown risks. By optimizing with indicator combos and risk controls, it can be tuned into a stable strategy.
- 1