Dynamic Filter Quant Trading Strategy

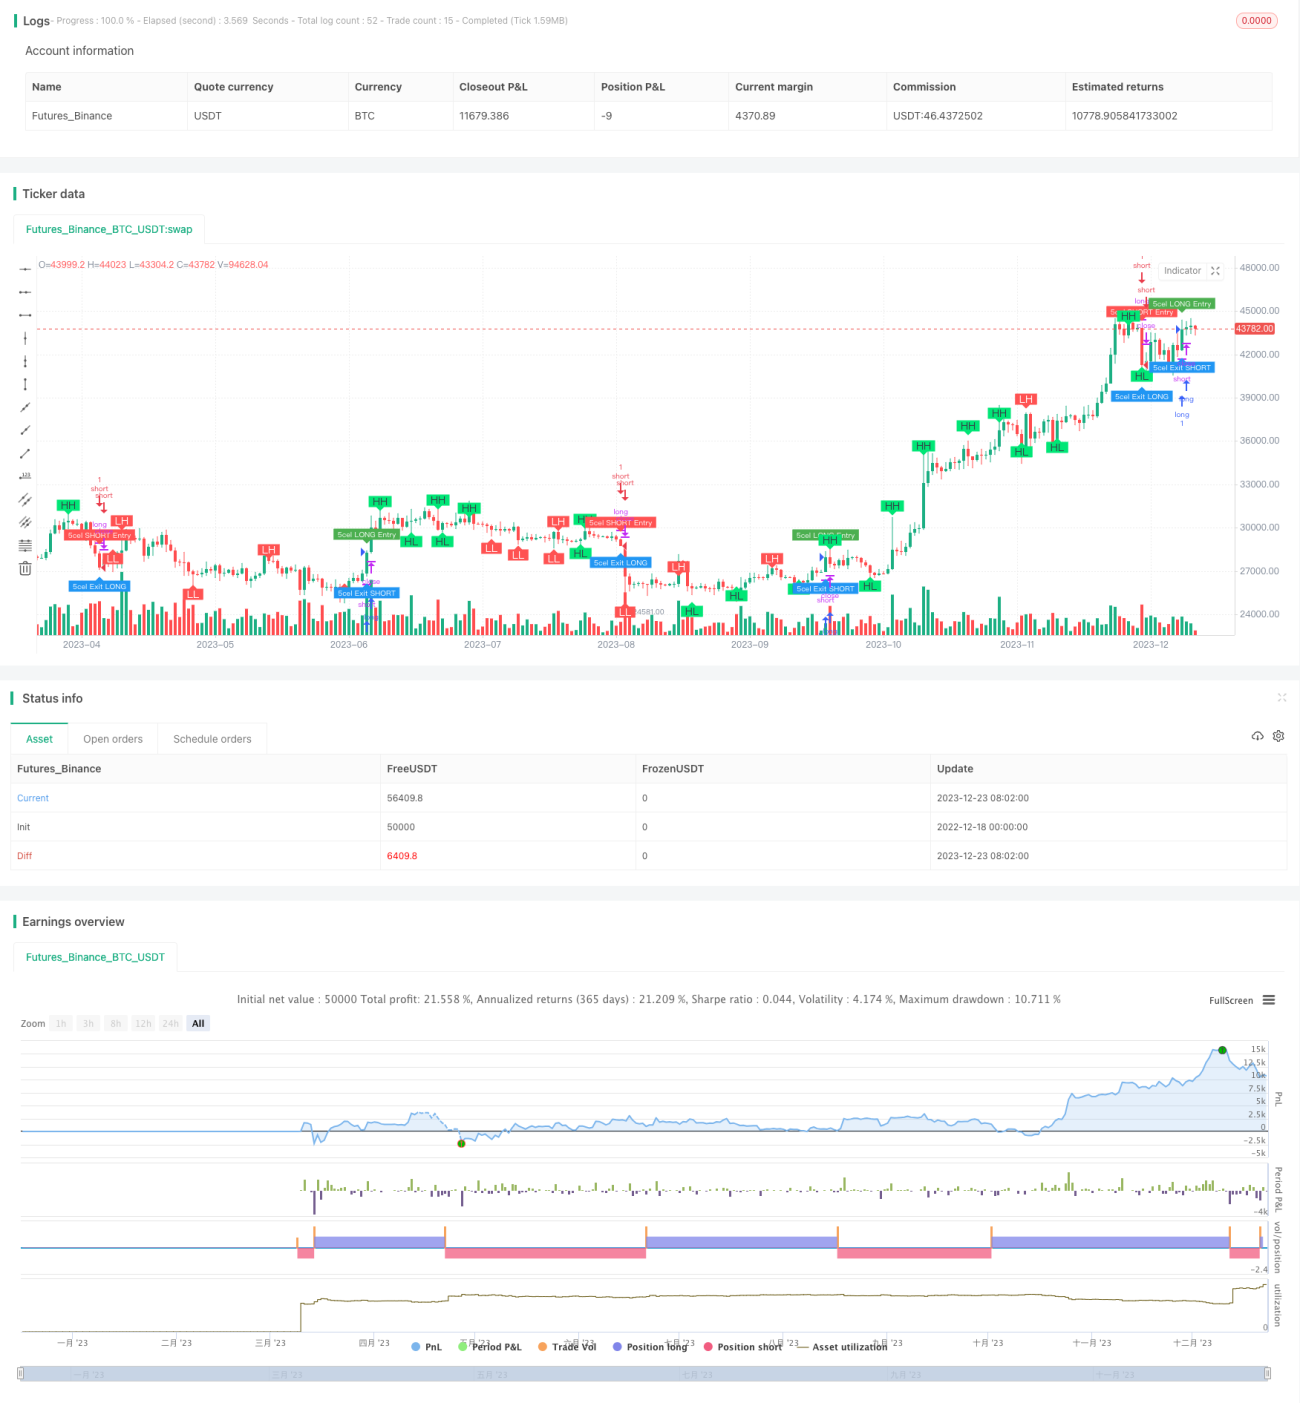
Strategy Overview
This strategy named Dynamic Filter Quant Trading Strategy mainly uses Range Filter indicator combined with multiple technical indicators to implement automated trend tracking trading of the cryptocurrency BTCUSDT. The strategy is suitable for high-frequency quant trading by dynamically adjusting stop loss and take profit to lock in profits and reduce drawdowns.
Strategy Logic
The core indicator of this strategy is Range Filter, which generates a median line based on the statistical price movement range. Trading signals are generated when the price breaks through this median line. In addition, the strategy also combines RSI indicator to judge overbought and oversold, moving average to determine the trend, MACD to judge momentum and other indicators for combined filtering to form more reliable trading signals.
Specifically, the median line of the Range Filter is obtained from the exponential moving average of the price movement range, and the directional judgement is based on the strength and speed of breaking through this median line. When the price breaks through the median line continuously over several candlesticks, a strong breakout signal is generated.
The RSI indicator that judges the overbought and oversold state is used to confirm the filter signal. When the moving average points up, the trend is judged to be up, and when it points down, the trend is judged to be down. The MACD indicator judges whether the market momentum is sufficient to form a trend.
By combining the judgments of these indicators, relatively reliable trend breakthrough points can be identified as opportunities to establish positions.
Advantage Analysis
The biggest advantage of this strategy is that it combines multiple indicators for decision making instead of relying on a single technical indicator, which can effectively reduce the probability of wrong trades and ensure that trading signals are more reliable. In addition, the dynamic adjustment of parameters also enables the strategy to adapt to market changes.
Another advantage is that high-frequency trading can be performed. The Range Filter indicator is very sensitive to price changes over small periods, which means that the strategy can open and close positions in a relatively short period of time, so it is very suitable for high-frequency trading and allows profits to be made in the volatile cryptocurrency market.
Risk Analysis
This strategy still has some risks. The first is the risk that technical pattern judgments fail because indicators cannot guarantee price movements 100%. When prices reverse, it may lead to stop loss.
Another major risk is that the median line of the Range Filter cannot completely filter out price fluctuations. When there is a larger price fluctuation beyond the range of the median line, the median line will fail, resulting in the risk of generating wrong signals. In this case, the parameters can be appropriately relaxed to expand the range of the median line.
Finally, high-frequency trading itself also carries some risks. When the trading frequency is too high, transaction costs will be relatively large, which may offset some profits. In this case, the trading frequency and holding time can be appropriately reduced.
Optimization
There is still room for further optimization of this strategy. For example, more indicators can be considered, such as volatility indicators to confirm trends and establish stricter filtering criteria to ensure more precise trading signals. Or study the price behavior patterns of different cryptocurrencies and stocks, and set indicator parameters that best suit them.
From the trading logic, dynamic stop loss and take profit ranges can also be set. That is to say, when the position size increases, the stop loss range can be expanded to lock in more profits. Or when the profit is relatively large, accelerate the take profit speed. This can reduce drawdowns to some extent.
Finally, the filter parameters can be optimized to find a set of parameters so that the median line range can effectively filter out fluctuations while capturing trend turning points as much as possible. This requires a lot of backtest data for iterative analysis.
Summary
This strategy successfully combines multiple indicators for judgment to form a highly reliable trading strategy suitable for high-frequency quantitative trading. With continuous optimization and improvement, it is believed that stable returns can be obtained and it is worth further development.
/*backtest
start: 2022-12-18 00:00:00
end: 2023-12-24 00:00:00
period: 1d
basePeriod: 1h
exchanges: [{"eid":"Futures_Binance","currency":"BTC_USDT"}]
*/

//@version=5
strategy(title='5cel Scalp Strategy BTCUSDT Long & Short 30 Min', shorttitle='BTCUSDT Long & Short Scalp 30m', precision=1, overlay=true)

//Swing Call - Based on RSI Overbought & Oversold- 1