Trend Following Strategy Based on RSI and Weighted Moving Average

Overview
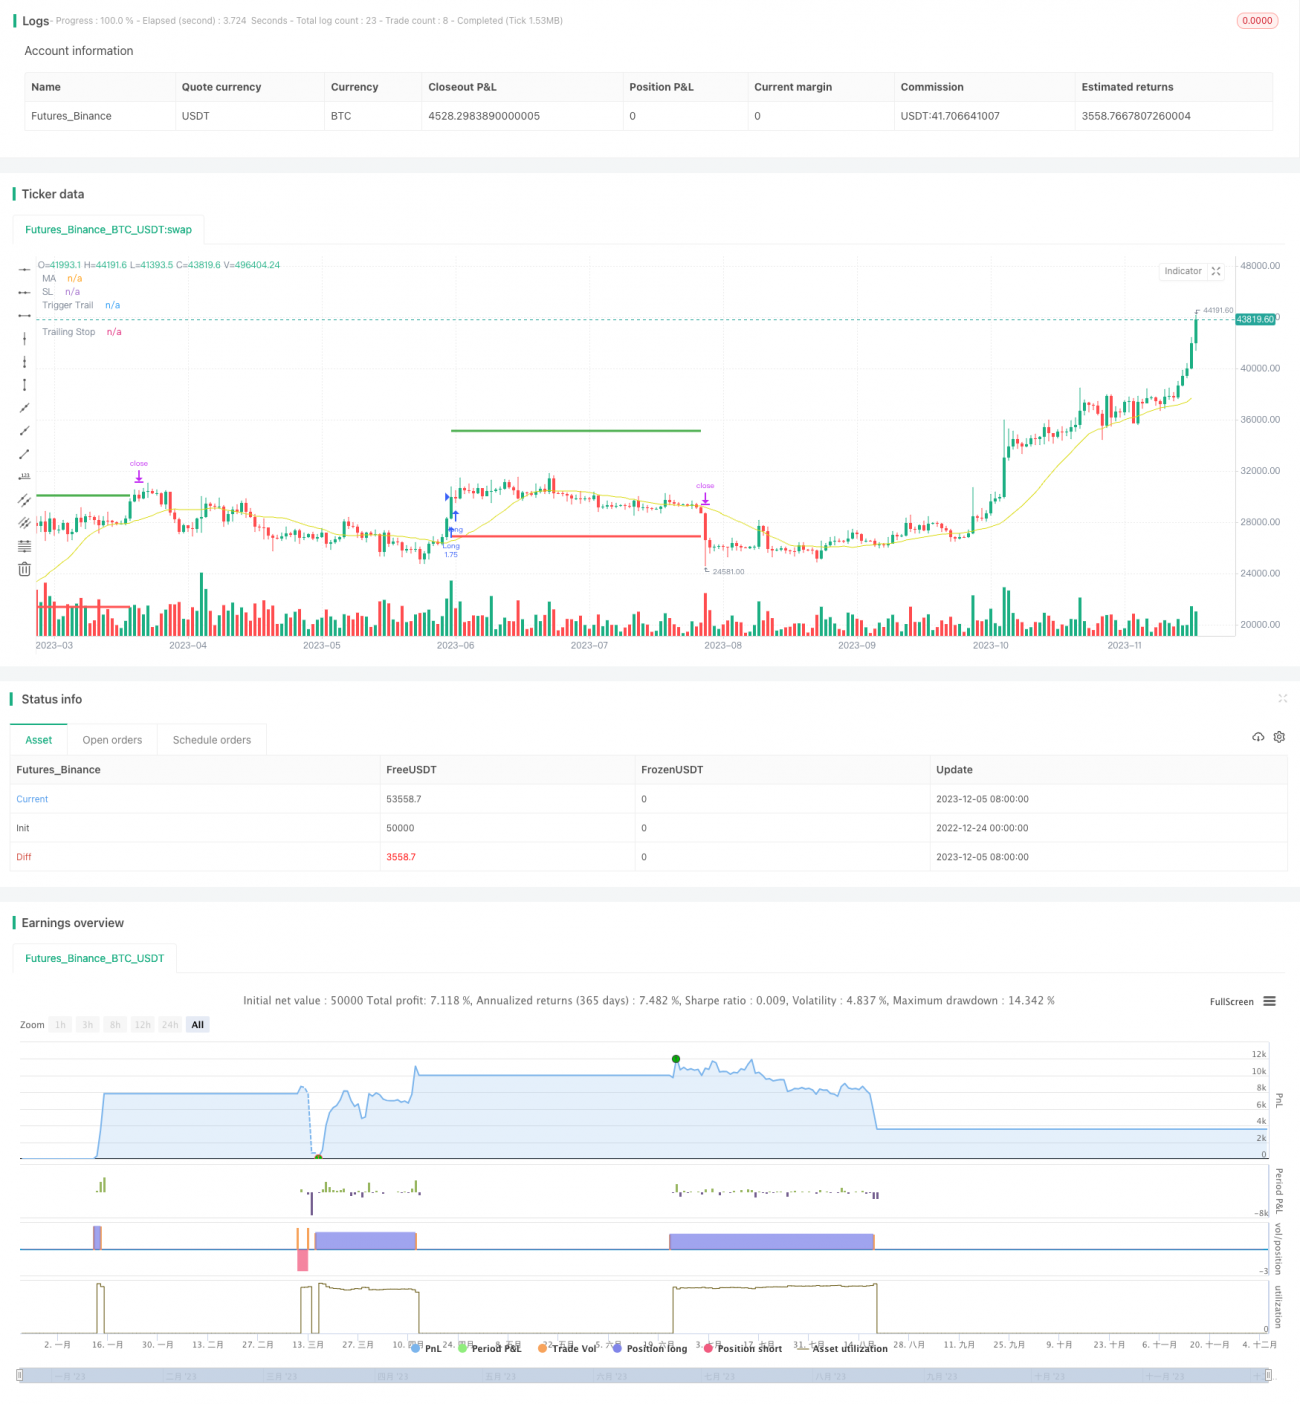
This strategy is based on two well-known indicators: Relative Strength Index (RSI) and Weighted Moving Average (WMA). It identifies market trend and follows its direction. RSI judges overbought/oversold levels, WMA determines price trend. The combination of both can filter out irrelevant signals effectively and improve profitability. This is a medium/long-term strategy, coupled with money management method to adjust position size based on gain/loss.
Strategy Logic
RSI Indicator
RSI is one of the best-known overbought/oversold indicators. Its formula is:
\[RSI = 100 - \frac{100}{1+\frac{AvgGain}{AvgLoss}}\]
Where AvgGain is the average of days that close is above open over past x days, AvgLoss is the average of absolute value of days that close is below open over past x days.
This strategy sets RSI period as 20 to judge the trend. RSI above 60 generates long signal, RSI below 40 generates short signal.
Weighted Moving Average (WMA)
Compared with SMA, WMA weights recent prices more heavily. Its formula is:
\[WMA = \frac{\sum_{i=1}^n w_i x_i}{\sum_{i=1}^n w_i}\]
Where w is the weight, w grows exponentially with increasing i. This strategy uses following weight formula:
\[w = \begin{cases} 100/(4+(n-4)*1.3), & i <= 3 \\ 1.3*w, & i > 3 \end{cases}\]
Namely the weight is equal in last 3 days, and grows 1.3 times every 1 day backward. This highlights influence of recent prices.
The WMA length in this strategy is 20.
Strategy Signals
Long signal: RSI > 60 and 20-day ROC of WMA < -1
Short signal: RSI < 40 and 20-day ROC of WMA > 1
Where 20-day ROC of WMA is calculated as:
\[ROC = (WMA_{today}/WMA_{20\_days\_ago} - 1) \times 100\]
Advantages
- Use RSI to determine trend direction, avoid losing money in whipsaw markets
- WMA weights recent prices to reduce noise and identify major trend
- Combination of RSI and WMA ROC filters out irrelevant signals
- Multiple ATR trailing take-profit, flexible profit-taking
- Money management adjusts position size based on gain/loss, controls risk
Risks
- Improper parameter settings may increase trading frequency
- Improper stop loss setting may expand losses
- As trend following strategy, not suitable for range-bound market
- Pay attention to macro environment changes, manual intervention if necessary
Improvement Directions
- Test RSI length, WMA length, ROC threshold to find optimum parameter set
- Test different money management methods to find best position adjustment plan
- Add other indicators for further signal filtering
- Incorporate stop loss strategy to limit per trade loss risk
- Optimize take profit strategy to maximize profit during trend
Conclusion
This strategy combines RSI and WMA to determine trend direction, aiming to profit from major trend over medium/long term. Money management and profit taking strategies also used to control risks. It has practical value but parameter settings and stop loss mechanism need continuous testing and optimization for better results. Investors should assess situation, intervene manually if necessary, and ensure controllable risks.
- 1