Trend Reversal Trading Strategy Based on EMA Crossover

Overview
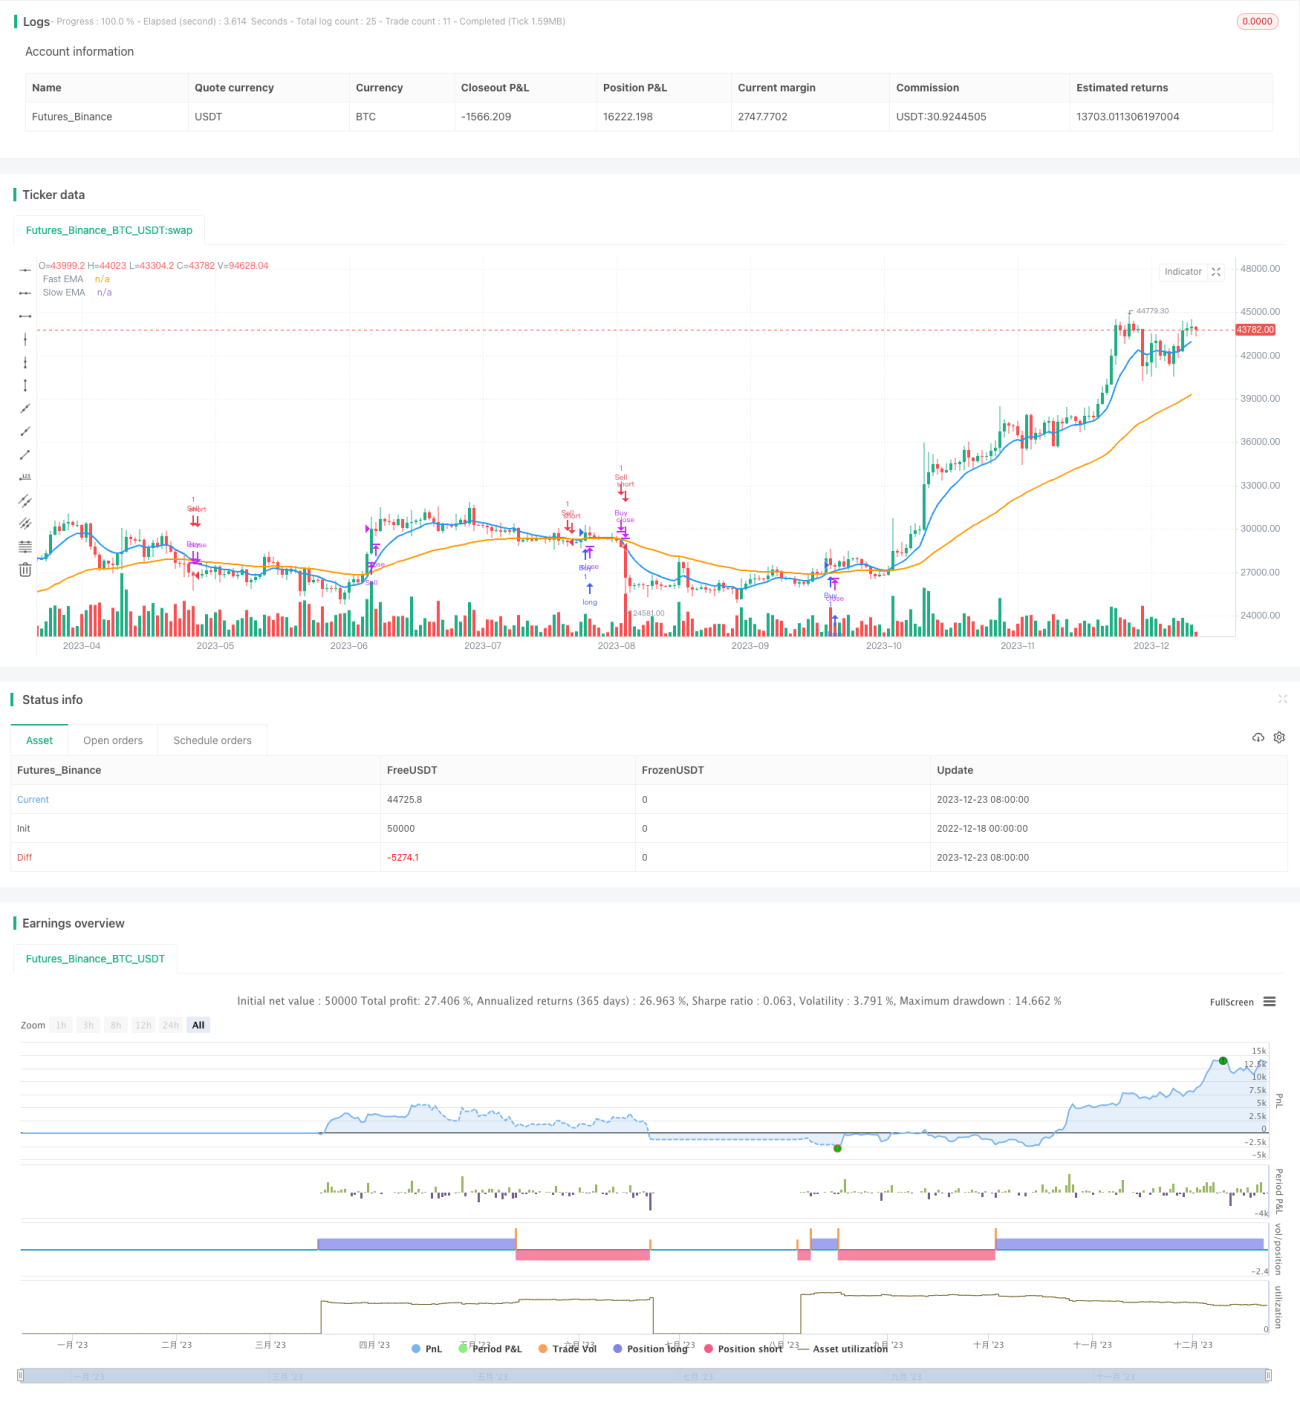
This strategy calculates the exponential moving average (EMA) of fast and slow periods, plots them on the chart, and monitors crossovers in real-time to determine trend reversals. Trading signals are formed by incorporating the RSI oscillator to avoid false signals. A buy signal is generated when the fast EMA crosses above the slow EMA. A sell signal is generated when the fast EMA crosses below the slow EMA.
Strategy Logic
- Calculate EMAs of fast and slow periods
- Plot on chart and monitor crossovers in real-time
- Fast EMA crossing above slow EMA indicates uptrend, buy signal
- Fast EMA crossing below slow EMA indicates downtrend, sell signal
- Incorporate RSI to avoid false signals
- Trend filter to trade only on trend change
Advantage Analysis
- EMAs smooth price action, less sensitive to minor fluctuations
- RSI filters out false reversal signals
- Customizable EMA and RSI parameters for different markets
- Simple and intuitive code, easy to understand
Risk Analysis
- EMAs have lag, may miss turning points
- Fail in ranging, volatile markets
- Need to adjust EMA and RSI parameters
- Should combine other indicators
Optimization
- Add filters to increase signal reliability
- Implement stop loss to control risk
- Test stability across periods
- Incorporate currency strength meter
- Optimize risk-reward ratio
Conclusion
The strategy has a clear logic using EMA crossovers to determine trend reversal, filtered by RSI to capture mid- to long-term trends. However, optimization of EMA/RSI parameters and stop loss, as well as the risk of missing reversals and failure in volatile markets remain. With tuned parameters and risk controls, it could serve to identify turning points and formulate investment decisions.
- 1