Overview
This is a tracking supertrend strategy that mainly combines supertrend indicators with different parameter settings to achieve a tracking effect and uses a filter indicator for risk control. The core idea of the strategy is simple and practical, easy to understand, and suitable for beginners to learn.
Strategy Principle
This strategy consists mainly of three groups of supertrend indicators with different parameter settings. The first group is the main supertrend indicator that uses the default parameters for basic judgment of market trends. The second group is the deputy supertrend indicator which achieves more sensitive tracking of price changes by reducing the ATR period and increasing the ATR multiplier. The third group is the filter supertrend indicator which appropriately increases the ATR period and ATR multiplier to filter false breakouts.
When the main supertrend issues a buy signal, if the deputy supertrend also issues a synchronized signal and the filter supertrend direction is upward, the strategy will take tracking buy. When the main supertrend issues a sell signal, if the deputy supertrend also issues a synchronized signal and the filter supertrend direction is downward, the strategy will take tracking sell. This can capture the main trend while using the flexible deputy supertrend indicator to track minor adjustments and achieve timely entry and stop loss.
Advantages
- The strategy idea is simple and clear, easy to understand, suitable for beginners to learn
- The strategy parameter setting is reasonable to effectively track the market and control risks
- The strategy signal is more accurate and reliable with higher win rate
- Combining different parameter combinations to achieve tracking effect
- Adding filter mechanism can effectively filter false signals and control risks
Risks
- Systematic risks inherent in the stock itself
- Supertrend indicator may lag in some markets
- Improper ATR parameter settings may cause signal deviations
- Insufficient trading volume may make it difficult to fully cut losses
Main Risk Prevention Measures:
- Choose stocks with good liquidity and large fluctuations
- Reasonably optimize parameters to reduce the possibility of lagging
- Parameter testing and optimization to improve signal accuracy
- Appropriately increase transaction volume to ensure loss cutting space
Optimization Directions
- Test different combinations of ATR periods to optimize tracking effect
- Try other volatility indicators to replace ATR
- Increase or decrease the number of supertrend combinations to test the effect
- Try to combine with other indicators for signal filtering optimization
- Test different stop loss methods to find the optimal solution
Summary
The overall idea of this strategy is clear and simple. By coordinating multiple groups of supertrend indicators with different parameter settings, it realizes tracking entry and risk control. The strategy signal is more accurate with good live performance. It is suitable for beginners to learn, and can also be used as a template for testing and optimizing various indicators and parameters. This is a supertrend strategy worth recommending.
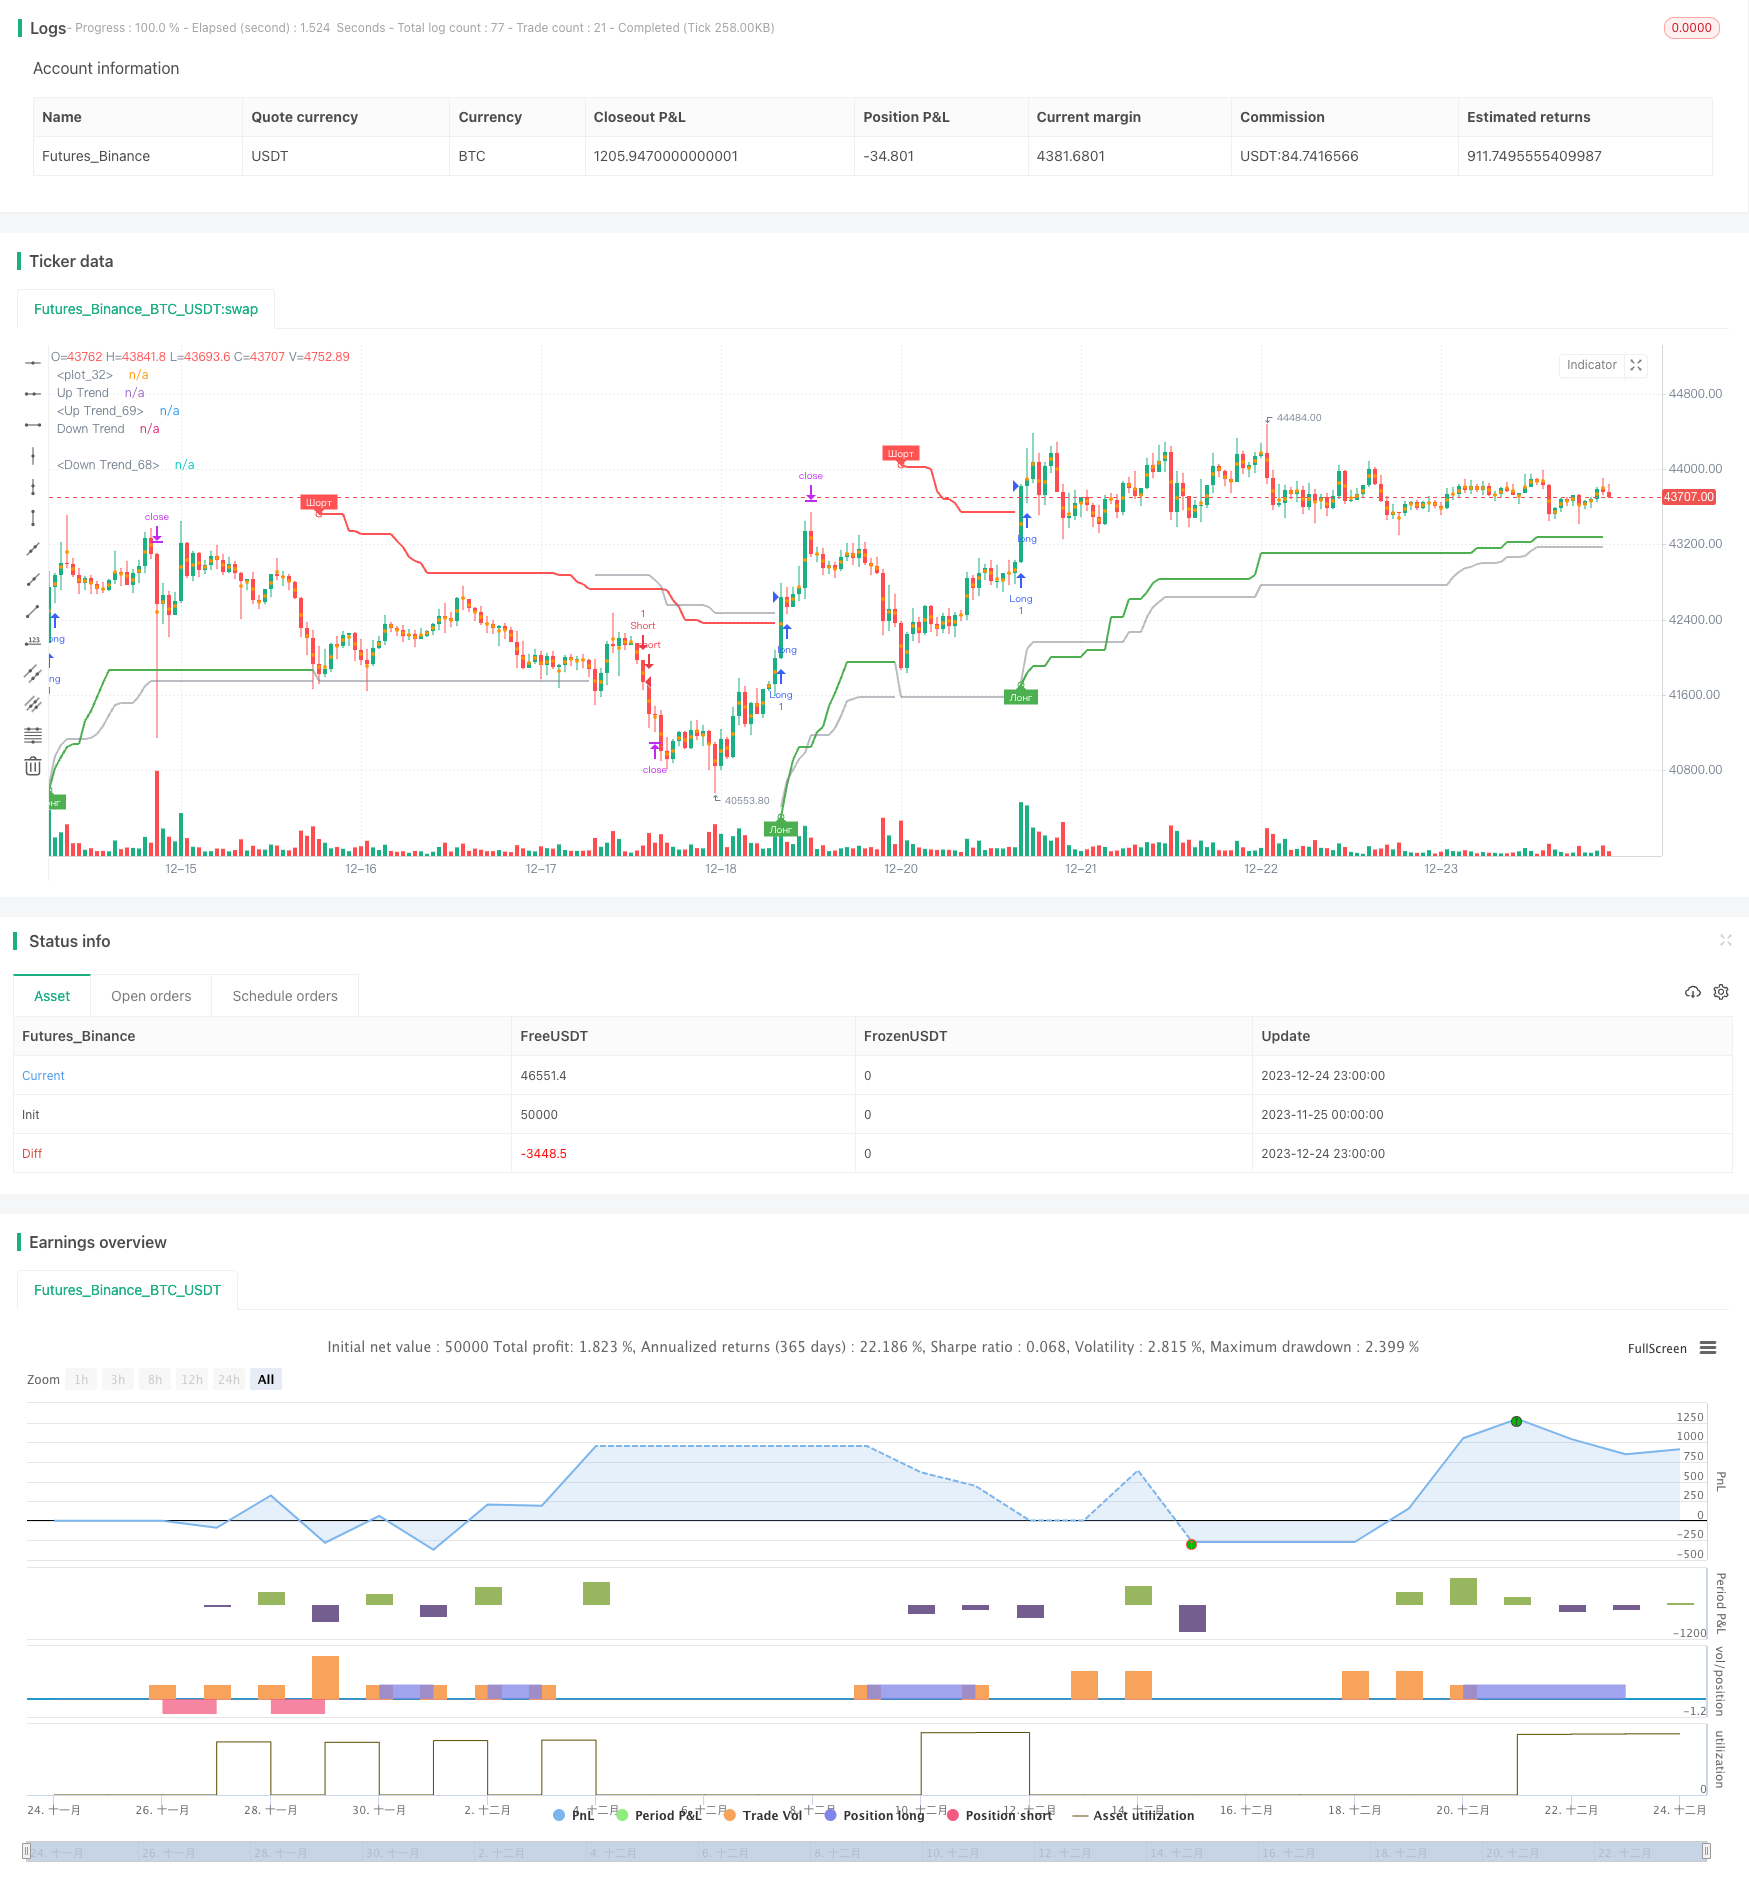
/*backtest
start: 2023-11-25 00:00:00
end: 2023-12-25 00:00:00
period: 1h
basePeriod: 15m
exchanges: [{"eid":"Futures_Binance","currency":"BTC_USDT"}]
*/

//@version=4
strategy("Supertrend TEST 2 Strategy", overlay = true, format=format.price, precision=2)

Periods = input(title="ATR Period", type=input.integer, defval=4)
src = input(hl2, title="Source")
Multiplier = input(title="ATR Multiplier", type=input.float, step=0.1, defval=4.7)
changeATR= input(title="Change ATR Calculation Method ?", type=input.bool, defval=true)
showsignals = input(title="Show Buy/Sell Signals ?", type=input.bool, defval=true)
highlighting = input(title="Highlighter On/Off ?", type=input.bool, defval=true)
tp=close
sl=close

atr2 = sma(tr, Periods)
atr= changeATR ? atr(Periods) : atr2
up=src-(Multiplier*atr)
up1 = nz(up[1],up)
up := close[1] > up1 ? max(up,up1) : up
dn=src+(Multiplier*atr)
dn1 = nz(dn[1], dn)
dn := close[1] < dn1 ? min(dn, dn1) : dn
trend = 1
trend := nz(trend[1], trend)
trend := trend == -1 and close > dn1 ? 1 : trend == 1 and close < up1 ? -1 : trend
upPlot = plot(trend == 1 ? up : na, title="Up Trend", style=plot.style_linebr, linewidth=2, color=color.green)
buySignal = trend == 1 and trend[1] == -1
plotshape(buySignal ? up : na, title="UpTrend Begins", location=location.absolute, style=shape.circle, size=size.tiny, color=color.green )
plotshape(buySignal and showsignals ? up : na, title="Лонг", text="Лонг", location=location.absolute, style=shape.labelup, size=size.tiny, color=color.green, textcolor=color.white )
dnPlot = plot(trend == 1 ? na : dn, title="Down Trend", style=plot.style_linebr, linewidth=2, color=color.red)
sellSignal = trend == -1 and trend[1] == 1
plotshape(sellSignal ? dn : na, title="DownTrend Begins", location=location.absolute, style=shape.circle, size=size.tiny, color=color.red )
plotshape(sellSignal and showsignals ? dn : na, title="Шорт", text="Шорт", location=location.absolute, style=shape.labeldown, size=size.tiny, color=color.red, textcolor=color.white )
mPlot = plot(ohlc4, title="", style=plot.style_circles, linewidth=0)
longFillColor = highlighting ? (trend == 1 ? color.green : color.white) : color.white
shortFillColor = highlighting ? (trend == -1 ? color.red : color.white) : color.white

sPeriods=input(title="ATR Period", type=input.integer, defval=8)
sMultiplier=input(title="dop ATR Multiplier", type=input.float, step=0.1, defval=1.5)
satr2 = sma(tr, sPeriods)
satr= changeATR ? atr(sPeriods) : satr2
ssup=ohlc4-(sMultiplier*satr)
ssup1 = nz(ssup[1],ssup)
ssup := close[1] > ssup1 ? max(ssup,ssup1) : ssup
sdn=ohlc4+(sMultiplier*satr)
sdn1 = nz(sdn[1], sdn)
sdn := close[1] < sdn1 ? min(sdn, sdn1) : sdn
strend = 1
strend := nz(strend[1], strend)
strend := strend == -1 and close > sdn1 ? 1 : strend == 1 and close < ssup1 ? -1 : strend
sbuySignal = strend == 1 and strend[1] == -1
ssellSignal = strend == -1 and strend[1] == 1

fPeriods=input(title="ATR Period", type=input.integer, defval=10)
fMultiplier=input(title="filter ATR Multiplier", type=input.float, step=0.1, defval=5)
fatr2 = sma(tr, fPeriods)
fatr= changeATR ? atr(fPeriods) : fatr2
fup=ohlc4-(fMultiplier*fatr)
fup1 = nz(fup[1],fup)
fup := close[1] > fup1 ? max(fup,fup1) : fup
fdn=ohlc4+(fMultiplier*fatr)
fdn1 = nz(fdn[1], fdn)
fdn := close[1] < fdn1 ? min(fdn, fdn1) : fdn
ftrend = 1
ftrend := nz(ftrend[1], ftrend)
ftrend := ftrend == -1 and close > fdn1 ? 1 : ftrend == 1 and close < fup1 ? -1 : ftrend
fbuySignal = ftrend == 1 and ftrend[1] == -1
fsellSignal = ftrend == -1 and ftrend[1] == 1
tcolor=color.new(color.gray,50)
fdnPlot = plot(ftrend == 1 ? na : fdn, title="Down Trend", style=plot.style_linebr, linewidth=2, color=tcolor)
fupPlot = plot(ftrend == 1 ? fup : na, title="Up Trend", style=plot.style_linebr, linewidth=2, color=tcolor)


if (strategy.position_size > 0)
	tp:=tp[1]
	sl:=up
	strategy.exit("Long_TP/SL","Long",limit=tp, stop=sl)

if (strategy.position_size < 0)
	tp:=tp[1]
	sl:=dn
	strategy.exit("Short_TP/SL","Short",limit=tp, stop=sl)


if ((buySignal and  ftrend==1) or (sbuySignal and trend==1 and  ftrend==1))
	tp:=close+(close-up)*0.382
    strategy.entry("Long", strategy.long,  limit=tp, comment=tostring(round(tp)))
if ((sellSignal and ftrend==-1) or (ssellSignal and trend==-1 and  ftrend==-1))
	tp:=close-(dn-close)*0.382
    strategy.entry("Short", strategy.short, limit=tp, comment=tostring(round(tp)))