Multi-timeframe Quantitative Trading Strategy Based on PSAR, MACD and RSI

Overview
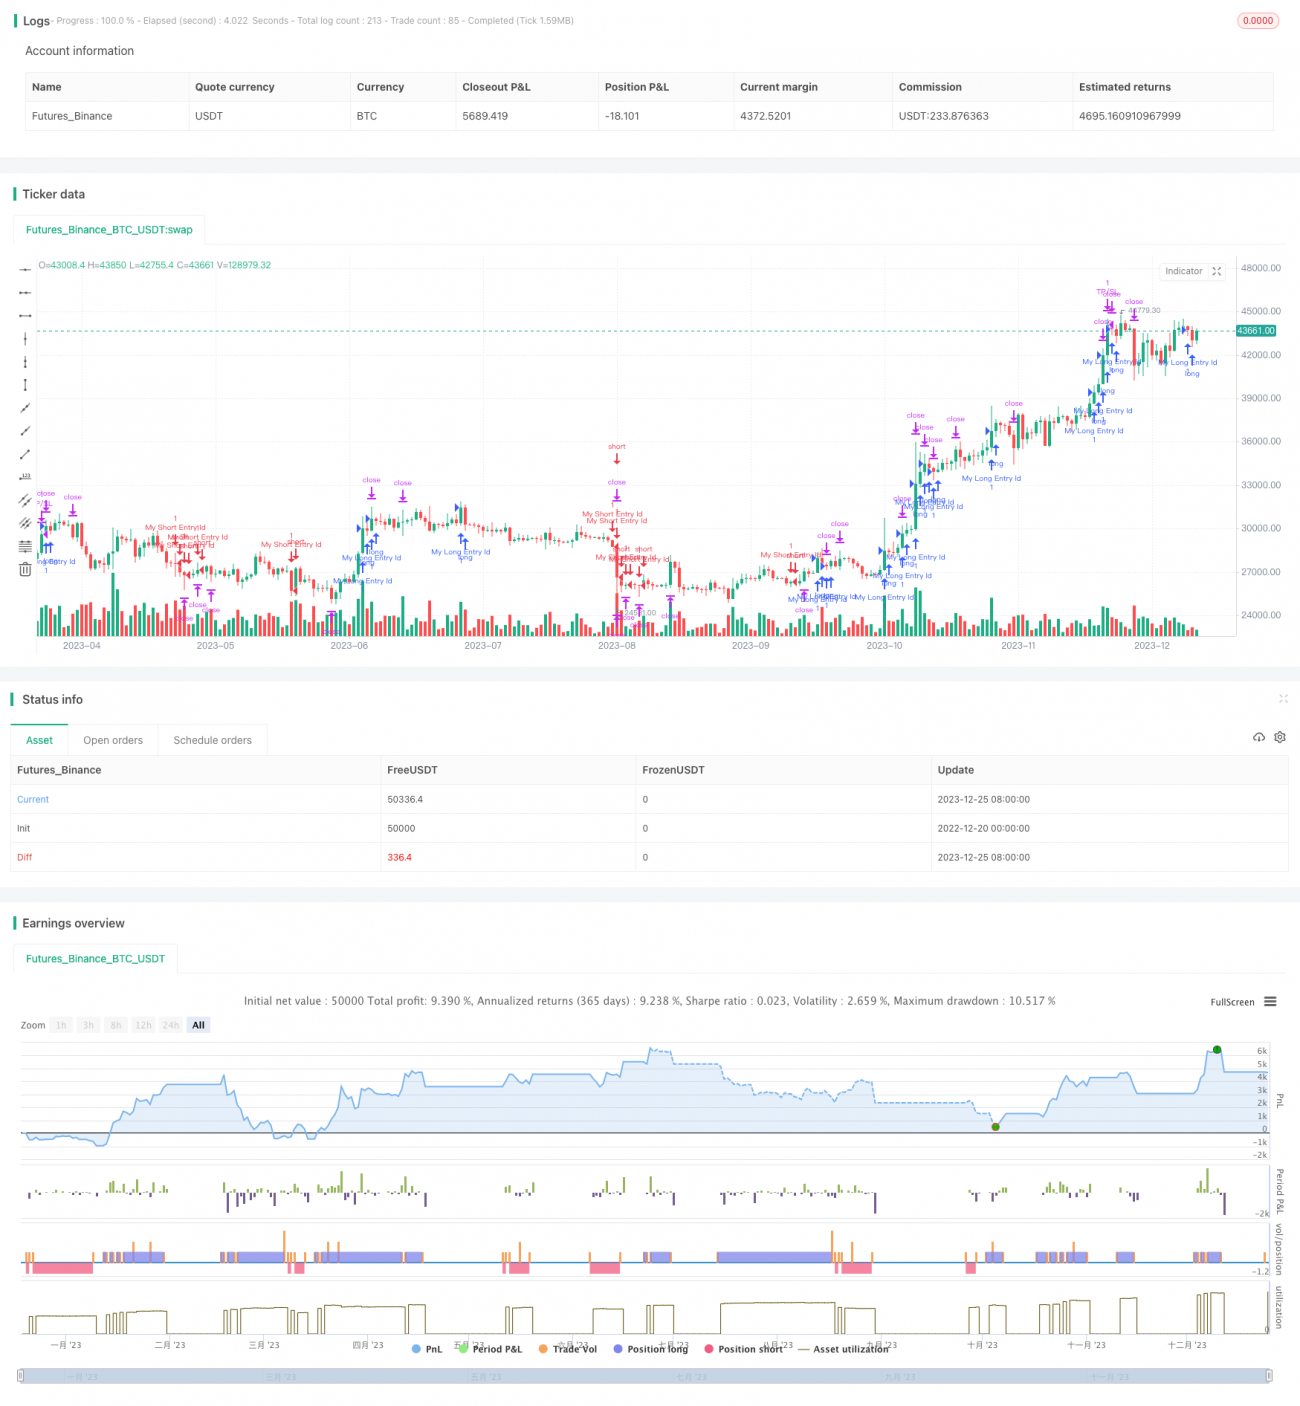
This strategy combines the Parabolic SAR, MACD and RSI indicators to implement automated long and short trading across multiple timeframes. It is mainly suitable for intraday trading of stocks and commodity products.
Strategy Principle
-
PSAR indicator is used to determine price direction and trend reversal points. Falling dots are bullish signals while rising dots are bearish signals.
-
MACD indicator judges price momentum. MACD line crossing above SIGNAL line upwards is bullish signal while crossing downwards is bearish.
-
RSI indicator judges overbought and oversold conditions. RSI above threshold is bullish while below is bearish.
-
Combine signals from the above three indicators to form final long/short decision.
-
Adaptively use Chop Index indicator to filter out consolidating markets to avoid whipsaws.
-
Use reverse pyramiding position sizing to dynamically manage risk and profit targets.
Advantages
-
Combination of multiple indicators judging trend, momentum and oscillators improves accuracy.
-
Adaptive to market conditions by filtering consolidating markets to prevent getting caught in traps.
-
Dynamic risk and profit management via reverse pyramiding position sizing with adaptive stops and limits.
-
Highly customizable with tunable parameters for different products and market environments.
-
Support multiple timeframes, flexible for short-term intraday or mid/long-term positional trades.
Risk Analysis
-
Long/short decisions depend on parameter settings which may cause mistakes if inappropriate.
-
Possibility of false signals leading to decisions against the trend.
-
Inappropriate stop loss and take profit settings may increase losses or reduce profits.
-
Requires frequent monitoring and parameter tweaking resulting in high human intervention costs.
Optimization Directions
-
Add model validation module to evaluate parameter settings and signal efficacy.
-
Increase machine learning module for automatic parameter and model optimization.
-
Ingest more data sources to enrich feature space and improve decisions.
-
Develop automated monitoring and maintenance systems to reduce human intervention.
-
Add backtesting and simulation evaluations to validate strategy performance.
Conclusion
This strategy realizes automated quantitative trading by combining multiple technical indicators rule-based system. With large optimization space and flexibility, it is suitable for parameter tuning, feature expansion and machine learning enhancements to better serve live trading.
- 1