Ichimoku Cloud and Bollinger Bands Combination Trading Strategy

Overview
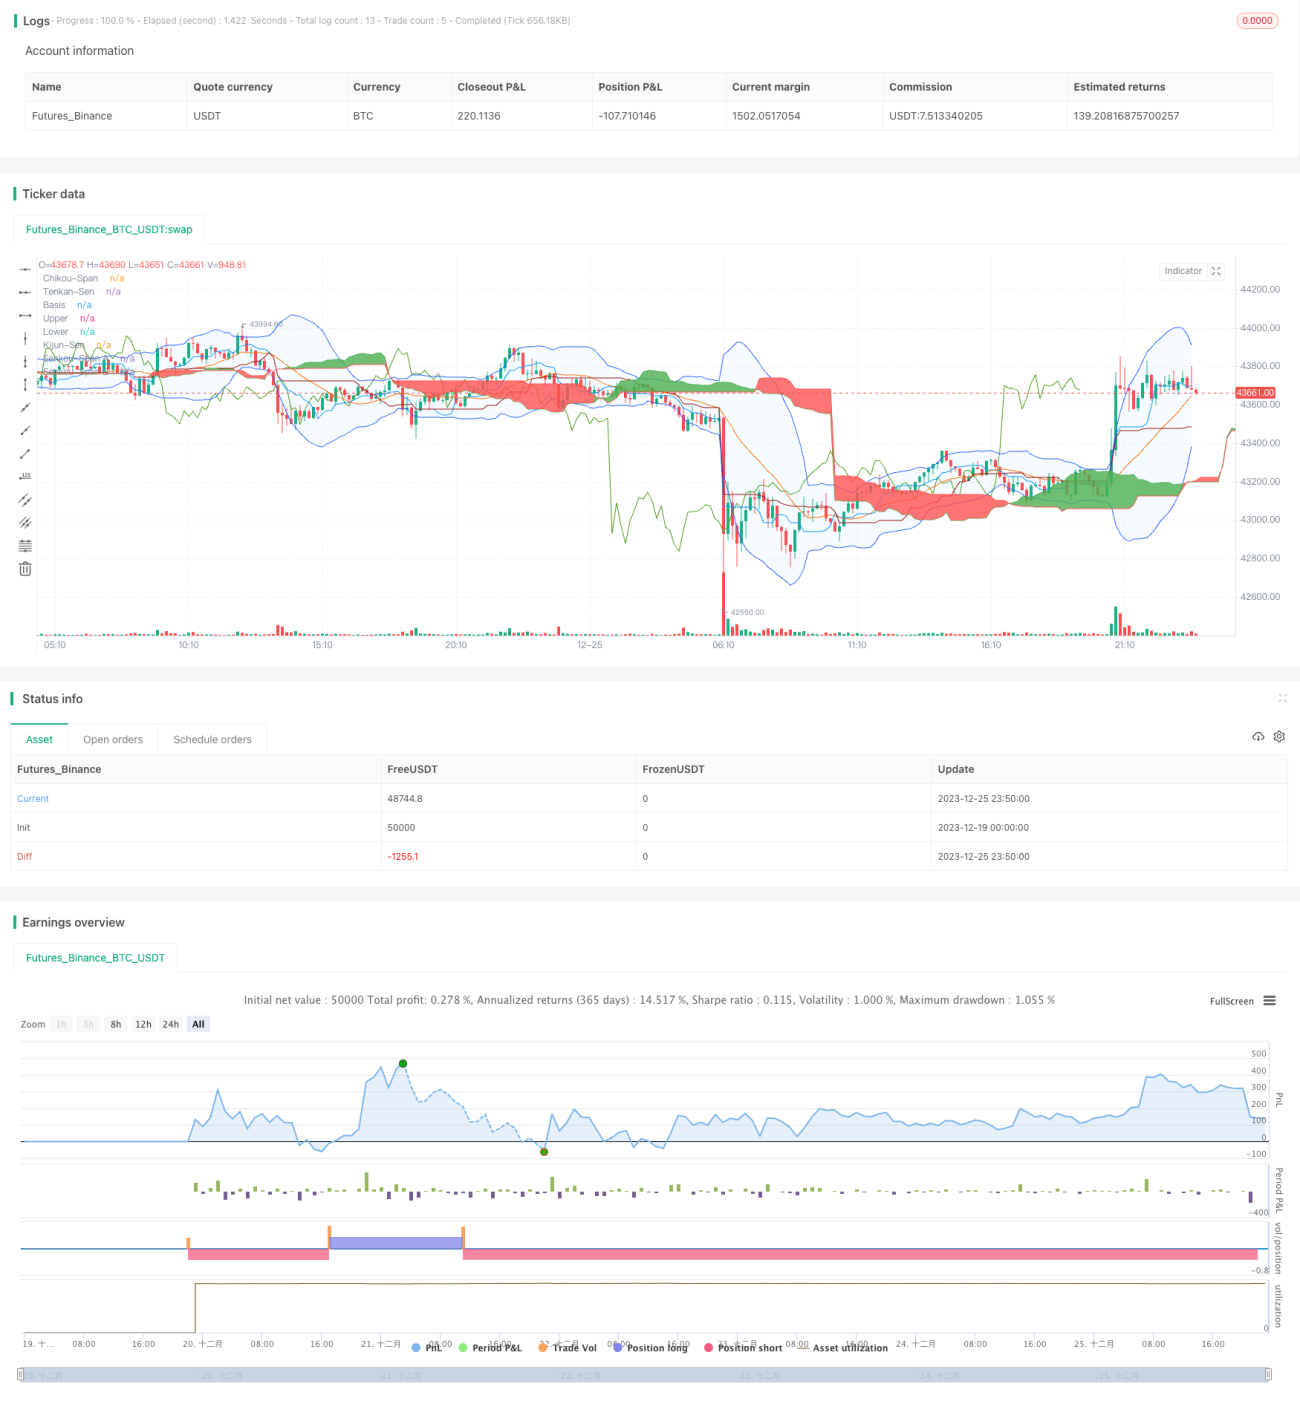
This strategy combines the Japanese Ichimoku Cloud indicator with the Bollinger Bands indicator to generate trading signals for long and short positions. The strategy can effectively determine market trends and make judgments when the Bollinger Bands indicator issues long and short signals to avoid erroneous trades.
Strategy Principle
-
The Ichimoku Cloud consists of the conversion line, base line, lagging line, and leading lines. The conversion line is a 9-day moving average and the base line is a 26-day moving average. When the conversion line is above the base line, it is a bullish signal, and vice versa for a bearish signal.
-
The lagging line is the lagging movement of prices. When the lagging line is above, it indicates a bullish trend. Below indicates a bearish trend.
-
The cloud bands consist of two leading lines, which are the 52-day moving average and the mean of the 26-day moving average. Prices above the cloud bands are considered bullish, while below is bearish.
-
The Bollinger Bands consist of n-day moving averages and standard deviations, representing volatility bands for prices. A break above the upper band indicates bulls in control while a break below the lower band suggests bears are in control.
-
This strategy forms trading rules based on the signals generated from the Ichimoku Cloud and the breakouts of the Bollinger Bands. For example, when the conversion line has an upward crossover over the base line, the lagging line is above, price breaks through the cloud bands, and also breaks through the upper band of the Bollinger Bands, it triggers a long entry signal.
Advantages of the Strategy
-
The Ichimoku Cloud clearly judges the trend direction, with the conversion and lagging lines indicating short-term trends and the cloud bands indicating medium to long term trend direction.
-
The Bollinger Bands determine whether prices are overextended, which can effectively filter out some unnecessary trades.
-
The combination of indicators makes trading signals clearer and more reliable, avoiding trading risks.
Risks and Optimization
-
Improper parameter settings for Bollinger Bands may lead to inaccurate trading signals. Parameters should be carefully set according to different underlying assets.
-
The position size should be appropriately adjusted to control risks. Excessively large positions can lead to greater losses.
-
Consider incorporating a stop loss strategy to stop losses when prices move beyond a certain range in an unfavorable direction.
-
Consider testing more indicators combined with the Ichimoku Cloud to form more reliable trading strategies.
Conclusion
This strategy effectively takes advantage of the Ichimoku Cloud to determine trend direction and the Bollinger Bands indicator to filter signals. The strategy signals are relatively clear and reliable. Through parameter adjustment and optimization of stop loss, trading risks can be reduced and good returns can be obtained.
- 1