Parabolic Stop and Reserve Multi-Indicator Trading Strategy

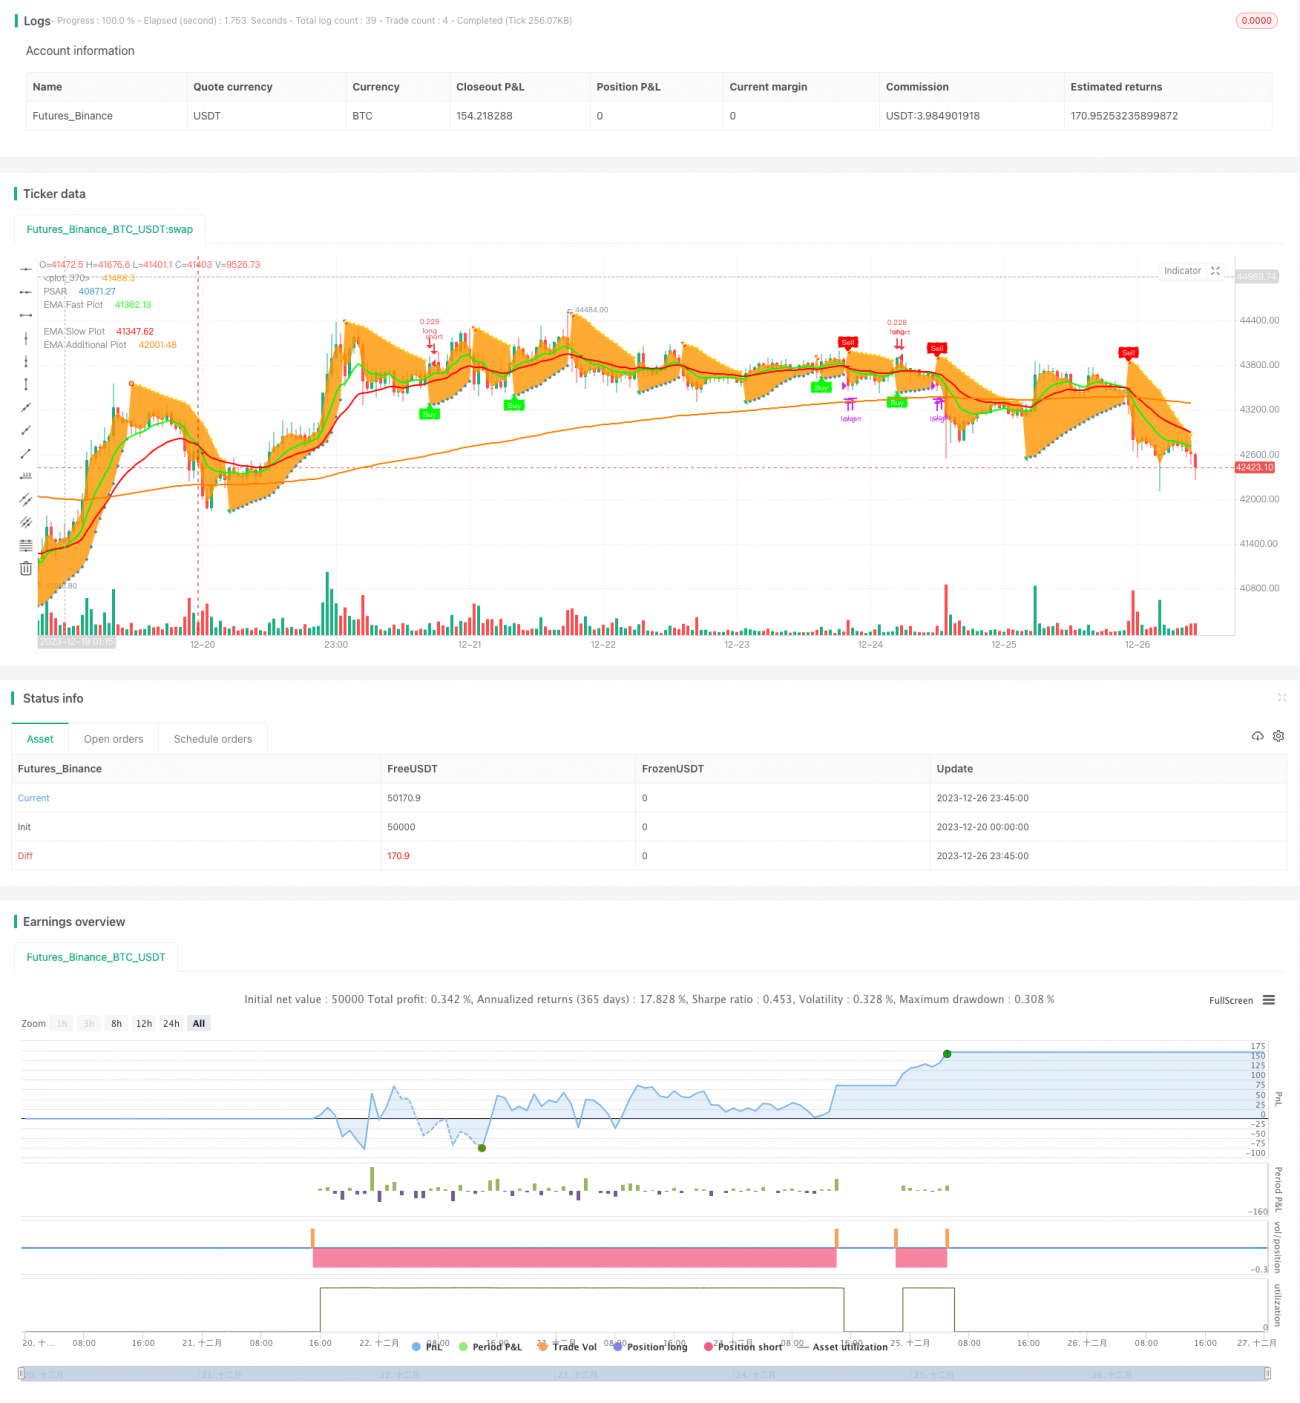
Overview
This strategy combines multiple technical indicators including Parabolic SAR, Triple Exponential Moving Average (TEMA), Exponential Moving Average (EMA), Relative Strength Index (RSI), On Balance Volume (OBV), etc. to identify price reversal signals of stocks, with additional trend filtering and stop loss to generate buy and sell signals.
Strategy Logic
The strategy uses Parabolic SAR as the primary indicator for price reversal signals. SAR appears above the price in bullish state and below the price in bearish state. When SAR breaks upwards from below the price, a sell signal is generated. When SAR breaks downwards from above the price, a buy signal is triggered.
To filter false signals, the strategy uses TEMA or EMA crossovers as confirmation signals. Only when SAR signal appears together with TEMA(fast line crosses above slow line) or EMA(fast line crosses above slow line) crossovers, a buy signal will be generated. Likewise, only SAR signal plus TEMA(fast line crosses below slow line) or EMA(fast line crosses below slow line) crossovers can trigger sell signals.
The strategy also provides RSI indicator and OBV indicator as alternative confirmation signals.
In addition, Triple EMA indicator plot is displayed to offer a clear view of the price trend. The modal indicator Ehler's eMAMA is also plotted to help identify trend reversal points.
A summary table of multiple indicator values is also presented at the bottom of the chart for quick overview.
Strengths
By combining SAR, EMA/TEMA, RSI, OBV and other indicators, the strategy can effectively detect price reversal signals and avoid false breakouts. With additional trend judgment from Triple EMA and eMAMA analysis, the accuracy can be further improved.
The rich graphical display of multiple indicators enables comprehensive market observation and analysis. The summary indicator table allows quick grasp of latest status of multiple indicators.
The trading logic rules are clear and parameters configurable, which makes the strategy adaptable to different trading instruments.
Risks
The strategy relies on indicator crossovers to generate signals. Incorrect indicator parameter settings may produce excessive noisy signals. Indicator parameters need tuning based on different trading instruments' characteristics.
In ranging and sideways markets, SAR indicator could generate frequent false signals. In these cases the confirmation from trend indicators should be taken into account.
Failure in strategy can also come from inappropriate choice of trading instruments. Instruments with significant trend are preferred for applying this strategy.
Optimization Directions
The strategy can be enhanced from the following aspects:
- Optimize SAR parameters to reduce noisy signals
- Optimize Moving Average parameters for better trend judgment
- Try out different confirmation indicators like RSI and OBV
- Add more auxiliary indicators for multi-timeframe analysis
- Optimize stop loss mechanisms to limit per trade loss
Conclusion
The Parabolic Stop and Reserve Multi-Indicator Trading Strategy integrates various commonly used technical indicators to form systematic buy and sell signals. It can effectively identify price reversal points. The configurable parameters make it easy to optimize for different trading instruments. Experienced quant traders can take advantage of this strategy. However parameter tuning based on specific instrument characteristics is a must. In addition trending instruments should be selected to avoid excessive noisy signals.
/*backtest
start: 2023-12-20 00:00:00
end: 2023-12-27 00:00:00
period: 45m
basePeriod: 5m
exchanges: [{"eid":"Futures_Binance","currency":"BTC_USDT"}]
*/

//
// ██╗      █████╗ ███████╗ ██████╗██╗██╗   ██╗██╗ ██████╗ ██╗   ██╗███████╗    ███╗   ███╗ ██████╗ ███╗   ██╗██╗  ██╗
// ██║     ██╔══██╗██╔════╝██╔════╝██║██║   ██║██║██╔═══██╗██║   ██║██╔════╝    ████╗ ████║██╔═══██╗████╗  ██║██║ ██╔╝
// ██║ ███████║███████╗██║ ██║██║ ██║██║██║ ██║██║ ██║███████╗ ██╔████╔██║██║ ██║██╔██╗ ██║█████╔╝ - 1