Mean Reversion Line Strategy

Overview
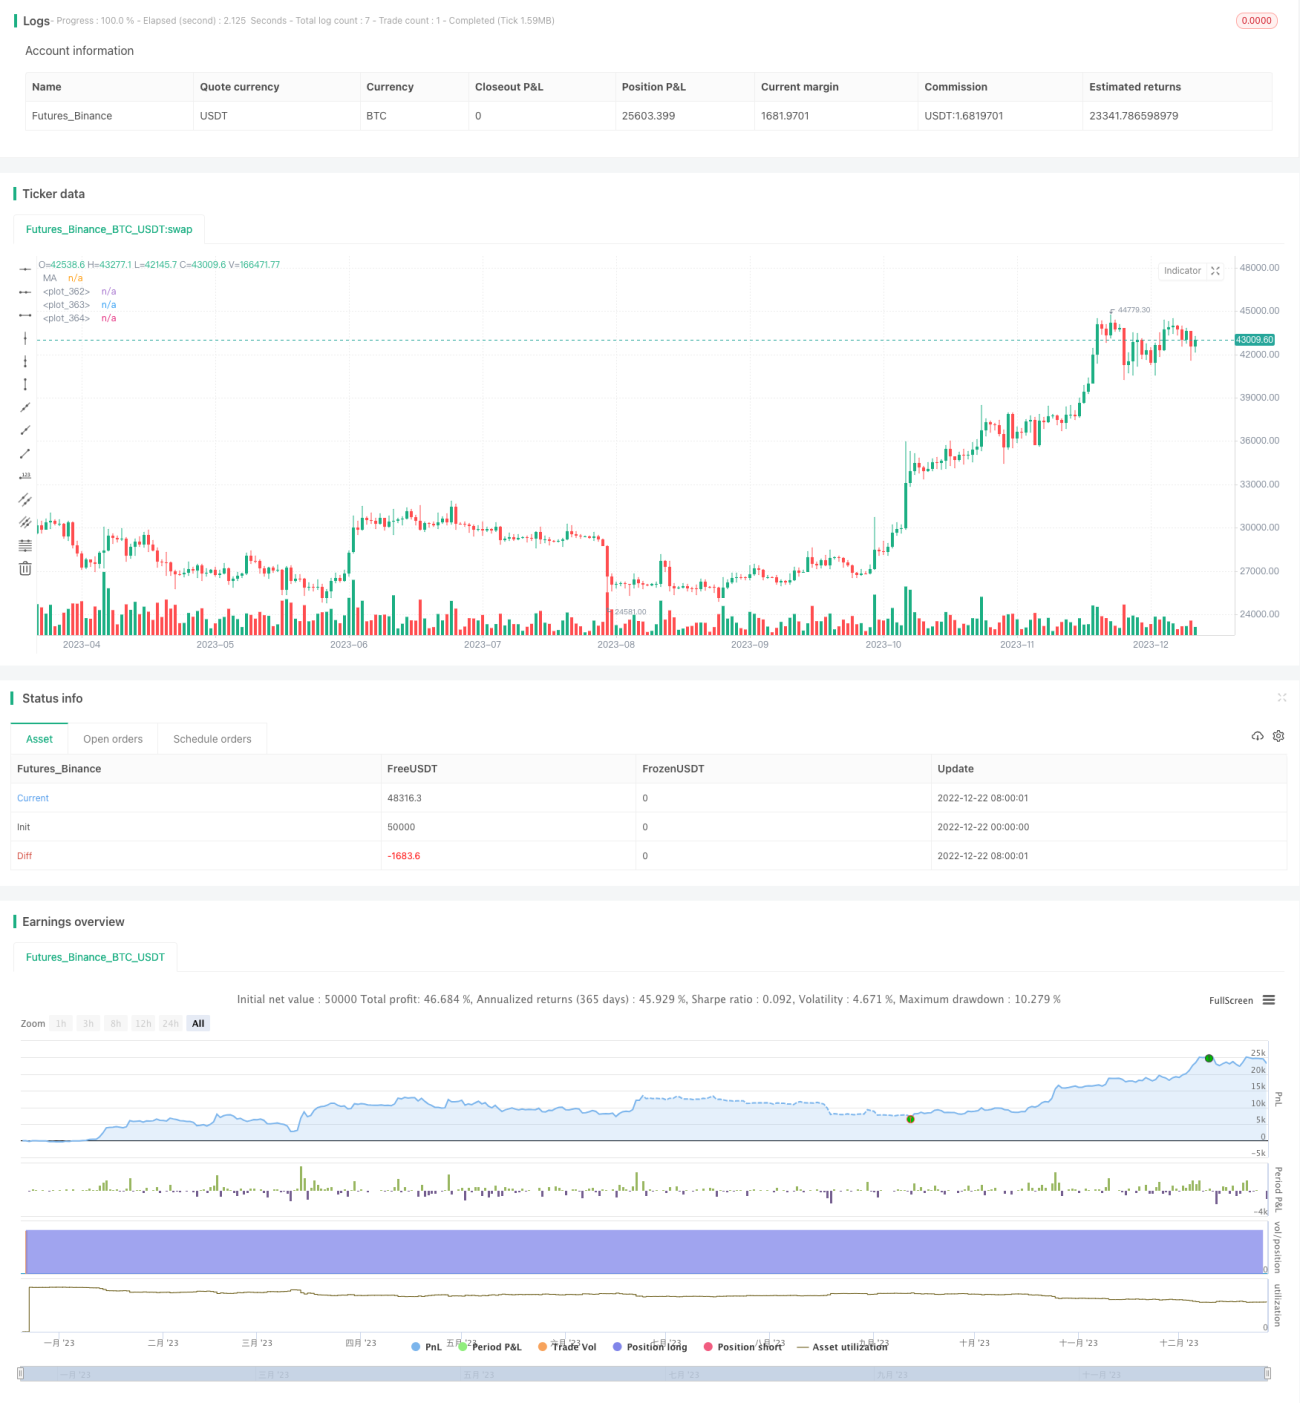
The mean reversion line strategy is a short-term trading strategy based on moving average reversals. It combines Bollinger Bands, RSI, CCI and other indicators to capture short-term market fluctuations and achieve the goal of buying low and selling high.
The strategy is mainly used for highly liquid products such as stock indexes, forex, and precious metals. It pursues maximization of profit per trade while controlling the overall risk-return ratio of trading.
Strategy Principle
-
Use Bollinger Bands to judge the price deviation zones. Consider going short when the price approaches the upper Bollinger Band and consider going long when the price approaches the lower Bollinger Band.
-
Combine the RSI indicator to determine overbought and oversold conditions. The RSI indicator can effectively identify overbought and oversold situations.
-
Use the CCI indicator to determine price reversal signals. The CCI indicator is relatively sensitive to anomalies and can effectively capture price reversal opportunities.
-
Go long when the price breaks above the 5-day moving average, and go short when it breaks below. The position of the moving average represents the current main price range, and the relationship between price and moving average reflects potential trend changes.
-
After the entry signal is confirmed, close the position quickly to take profits. Set stop loss based on retracement to realize high win rate.
Advantages of the Strategy
- Combination of multiple indicators improves signal accuracy
The mean reversion line strategy combines Bollinger Bands, RSI, CCI and other indicators. These indicators are quite sensitive to price changes, and their combination can improve signal accuracy and reduce false signals.
- Strict entry rules avoid chasing trends
The strategy requires synchronous indicator signals and prices to avoid misleading by a single indicator. It also requires obvious price reversal to reduce related risks.
- Efficient stop loss mechanism controls single trade loss
Whether going long or going short, the strategy will set a relatively strict stop loss line. Once the price breaks through the stop loss line in an unfavorable direction, the strategy will quickly stop loss to avoid large losses per trade.
- Reasonable profit taking pursues maximization of profit per trade
The strategy will set two take profit targets to realize profits in steps. At the same time, after taking profit, it will use small step adjustment tracking stop loss to expand the profit space per trade.
Risk Analysis
- Price volatility triggers stop loss
In the event of extreme price fluctuations, the stop loss line may be broken, causing unnecessary losses. Such situations usually occur during abnormal price movements caused by major events.
This risk can be mitigated by expanding the stop loss range and avoiding operations during major events.
- Unable to reverse after overheating rises
When the uptrend is too fierce, prices often rise too quickly to reverse in time. Persistently going short in this case may face the risk of chasing uptrends.
It is better to wait and see temporarily in this case, and consider going short only after the upward momentum has significantly weakened.
Optimization Directions
- Optimize indicator parameters to improve signal accuracy
Backtest results can be tested under different parameter combinations to select the optimal parameters. For example, RSI parameters, CCI parameters can be optimized.
- Incorporate volume indicators to determine true reversal timing
Volume indicators such as trading volume or Bollinger bandwidth can be added. This can avoid generating false signals when prices are only adjusting slightly.
- Optimize profit taking and stop loss strategies to maximize single profit
Different profit taking and stop loss points can be tested to maximize profit per trade. At the same time, risks should also be balanced to prevent the stop loss from being easily triggered.
Conclusion
The mean reversion line strategy comprehensively utilizes multiple indicator judgments and has the characteristics of accurate signals, sound operations, and controllable risks. It is suitable for products that are highly sensitive to market changes and have relatively strong liquidity. It can capture price reversal opportunities between Bollinger Bands and key moving averages to achieve the goal of buying low and selling high.
In practical applications, attention should still be paid to the optimization of indicator parameters, while combining volume indicators to determine the timing of real reversals. In addition, proper risk management should be taken against extreme price fluctuations. If used properly, this strategy can obtain relatively stable alpha returns.
- 1