Overview
This strategy uses the golden cross and death cross of dual EMA indicators to determine the current trend direction, and combines the RSI indicator to avoid missing buy and sell opportunities. It is a typical trend tracking strategy.
Strategy Principle
- Calculate the 10-period and 20-period EMA lines, named ma00 and ma01 respectively
- A buy signal is generated when ma00 crosses above ma01
- A sell signal is generated when ma00 crosses below ma01
- At the same time, when price crosses above ma00, if ma00 is above ma01, a buy signal will also be generated
- Similarly, when price crosses below ma00, if ma00 is below ma01, a sell signal will also be generated
- Through such dual validation, some buy and sell points can be avoided missing
- Set stop loss and take profit prices to control risks
Advantage Analysis
- Using dual EMA to determine can effectively filter false breakouts
- Dual condition validation avoids missing orders
- Stop loss and take profit settings are beneficial for risk management
Risk Analysis
- The dual EMA strategy belongs to the trend tracking strategy. Frequent buys and sells in sideways markets can easily hit stop loss
- It cannot accurately determine trend reversal points, which may lead to losses
- Improper stop loss point settings may amplify losses
Optimization Directions
- EMA cycles can be properly optimized to find the best parameter combination
- Other indicators can be added to improve strategy stability
- Dynamic stops can be set to adjust stop loss points in real time based on market fluctuations
Strategy source code
/*backtest
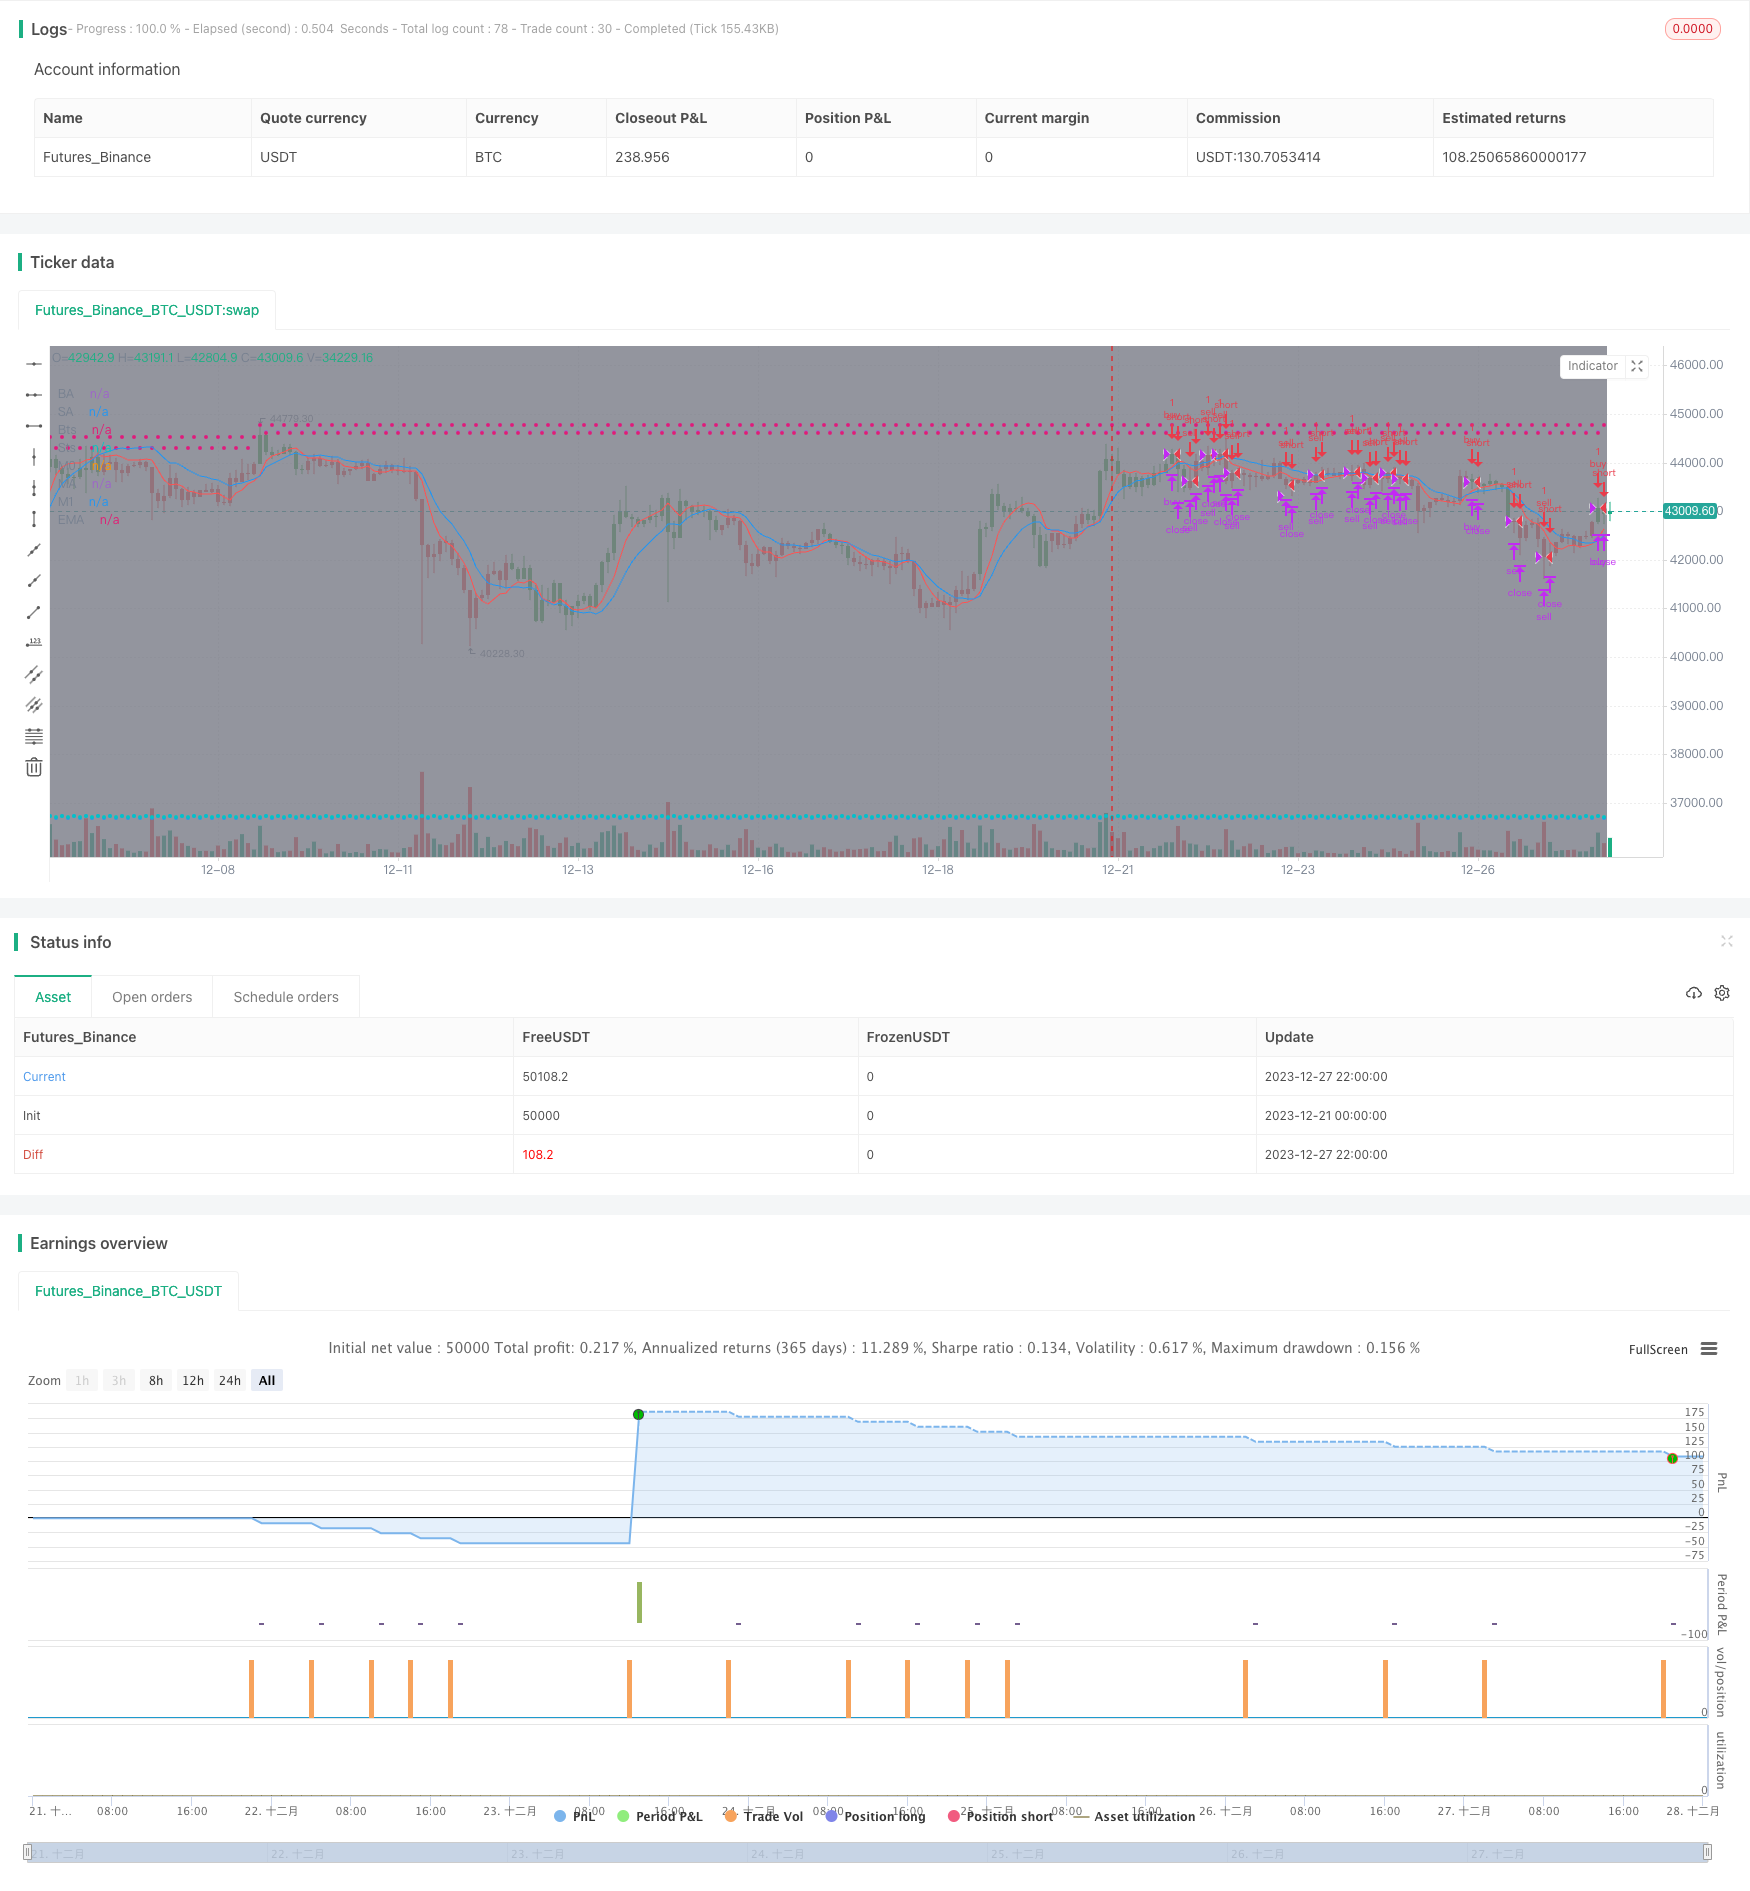
start: 2023-12-21 00:00:00
end: 2023-12-28 00:00:00
period: 2h
basePeriod: 15m
exchanges: [{"eid":"Futures_Binance","currency":"BTC_USDT"}]
*/
//@version=4
strategy(title='[STRATEGY][RS]MicuRobert EMA cross V1', shorttitle='S', overlay=true, pyramiding=0, initial_capital=100000)
USE_TRADESESSION = input(title='Use Trading Session?', type=bool, defval=true)
USE_TRAILINGSTOP = input(title='Use Trailing Stop?', type=bool, defval=true)
trade_session = input(title='Trade Session:', defval='0400-1500', confirm=false)
istradingsession = not USE_TRADESESSION ? false : not na(time('1', trade_session))
bgcolor(istradingsession?color.gray:na)
trade_size = input(title='Trade Size:', type=float, defval=1)
tp = input(title='Take profit in pips:', type=float, defval=55.0) * (syminfo.mintick*10)
sl = input(title='Stop loss in pips:', type=float, defval=11.0) * (syminfo.mintick*10)
ma_length00 = input(title='EMA length:', defval=10)
ma_length01 = input(title='DEMA length:', defval=20)
price = input(title='Price source:', defval=open)
// ||--- NO LAG EMA, Credit LazyBear: ---||
f_LB_zlema(_src, _length)=>
_ema1=ema(_src, _length)
_ema2=ema(_ema1, _length)
_d=_ema1-_ema2
_zlema=_ema1+_d
// ||-------------------------------------||
ma00 = f_LB_zlema(price, ma_length00)
ma01 = f_LB_zlema(price, ma_length01)
plot(title='M0', series=ma00, color=black)
plot(title='M1', series=ma01, color=black)
isnewbuy = change(strategy.position_size)>0 and change(strategy.opentrades)>0
isnewsel = change(strategy.position_size)<0 and change(strategy.opentrades)>0
buy_entry_price = isnewbuy ? price : buy_entry_price[1]
sel_entry_price = isnewsel ? price : sel_entry_price[1]
plot(title='BE', series=buy_entry_price, style=circles, color=strategy.position_size <= 0 ? na : aqua)
plot(title='SE', series=sel_entry_price, style=circles, color=strategy.position_size >= 0 ? na : aqua)
buy_appex = na(buy_appex[1]) ? price : isnewbuy ? high : high >= buy_appex[1] ? high : buy_appex[1]
sel_appex = na(sel_appex[1]) ? price : isnewsel ? low : low <= sel_appex[1] ? low : sel_appex[1]
plot(title='BA', series=buy_appex, style=circles, color=strategy.position_size <= 0 ? na : teal)
plot(title='SA', series=sel_appex, style=circles, color=strategy.position_size >= 0 ? na : teal)
buy_ts = buy_appex - sl
sel_ts = sel_appex + sl
plot(title='Bts', series=buy_ts, style=circles, color=strategy.position_size <= 0 ? na : red)
plot(title='Sts', series=sel_ts, style=circles, color=strategy.position_size >= 0 ? na : red)
buy_cond1 = crossover(ma00, ma01) and (USE_TRADESESSION ? istradingsession : true)
buy_cond0 = crossover(price, ma00) and ma00 > ma01 and (USE_TRADESESSION ? istradingsession : true)
buy_entry = buy_cond1 or buy_cond0
buy_close = (not USE_TRAILINGSTOP ? false : low <= buy_ts) or high>=buy_entry_price+tp//high>=last_traded_price + tp or low<=last_traded_price - sl //high >= hh or
sel_cond1 = crossunder(ma00, ma01) and (USE_TRADESESSION ? istradingsession : true)
sel_cond0 = crossunder(price, ma00) and ma00 < ma01 and (USE_TRADESESSION ? istradingsession : true)
sel_entry = sel_cond1 or sel_cond0
sel_close = (not USE_TRAILINGSTOP ? false : high >= sel_ts) or low<=sel_entry_price-tp//low<=last_traded_price - tp or high>=last_traded_price + sl //low <= ll or
strategy.entry('buy', long=strategy.long, qty=trade_size, comment='buy', when=buy_entry)
strategy.close('buy', when=buy_close)
strategy.entry('sell', long=strategy.short, qty=trade_size, comment='sell', when=sel_entry)
strategy.close('sell', when=sel_close)
//What i add .!
pos = iff(ma01 < ma00 , 1,
iff(ma01 > ma00 , -1, nz(pos[1], 0)))
barcolor(pos == -1 ? red: pos == 1 ? green : blue)
plot(ma00, color=red, title="MA")
plot(ma01, color=blue, title="EMA")